Senquip Portal
The Senquip Portal is Senquip’s secure cloud solution that is powered by Amazon Web Services (AWS). The portal allows for:
numerical and graphical viewing of current data,
long term data storage,
remote modification of settings,
remote updates to firmware,
event forwarding,
user account management.
By default, access to the Senquip Portal is enabled; it is highly recommended that users retain this setting. If disabled, device settings may not be able to be changed remotely and important firmware changes will not be able to be performed. Two instances where access to the portal may disabled are in very power battery operated applications and where the device is connected to an alternate server.
Warning
Disabling communication with the Senquip Portal will mean that no settings or firmware updates will be able to be performed remotely using the Senquip Portal.
Connection with the Senquip Portal is achieved using an MQTT connection. To ensure the highest levels data security, Senquip uses a NIST validated, ultra-secure hardware crypto-element for key and certificate storage and cryptographic processing. The crypto-element is pre-loaded with certificates for AWS, allowing for immediate, out-of-the box, secure communication with the Senquip Portal.
Using the Senquip Portal
This section describes the various features of the Senquip Portal and how to use them.
Login to the Senquip Portal
The Senquip Portal can be accessed at: https://portal.senquip.com/. At the welcome page, you will need to Login or Sign Up to access the portal. If you choose sign-up, you will be asked for your email address, name and a password.
Note
Password must be at least 8 characters and contain uppercase letters, lowercase letters and numbers.
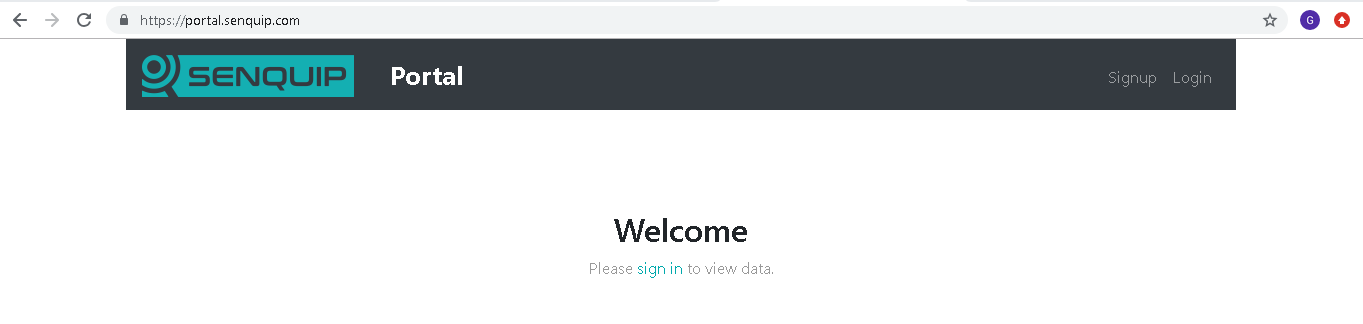
Welcome to the Senquip Portal
Device Summary
Once logged-in, on the summary page, a list of all devices associated with your account is shown. From the summary page, new devices can be added to your account, and can be grouped into logical categories. Where GNSS on a device is enabled, that device will be shown on a map below the list of devices. Note that where exceptions are present, they will be shown in the Events column; to see detail on the exceptions, select the device. In the Contact column, the time since last successful contact is shown; use this column to check that all devices are communicating as expected.
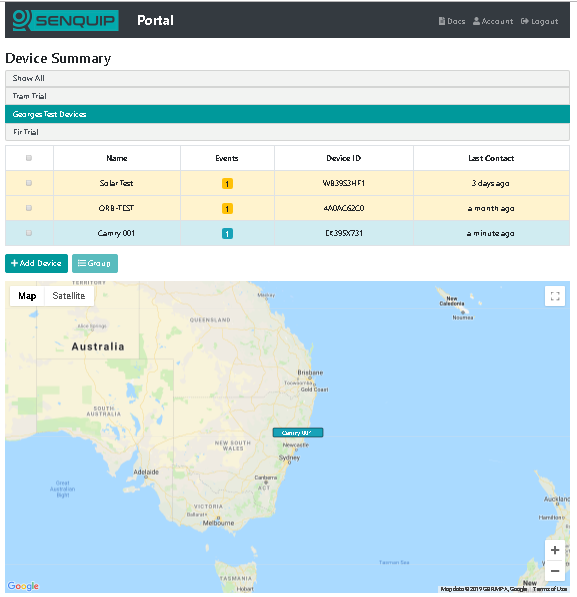
View or add Senquip devices
To add a device, click on the +Add Device button. You will be asked for the ID and password associated with the Senquip device. Enter the details and press Submit. The device will be added to the list of devices available on your user.
Note
The Device ID should look something like 7DA540190.
View Device Data
View the data associated with a Senquip device by clicking on the device Name or Device-ID. After a few seconds, a dashboard associated with the selected device will appear. The dashboard is user customisable in the following ways:
Widgets can be turned off so that they do not show on the dashboard.
Widgets can be re-ordered to change the order in which they are displayed.
An image associated with the machine or system being monitored can be added.
A company logo can be added.
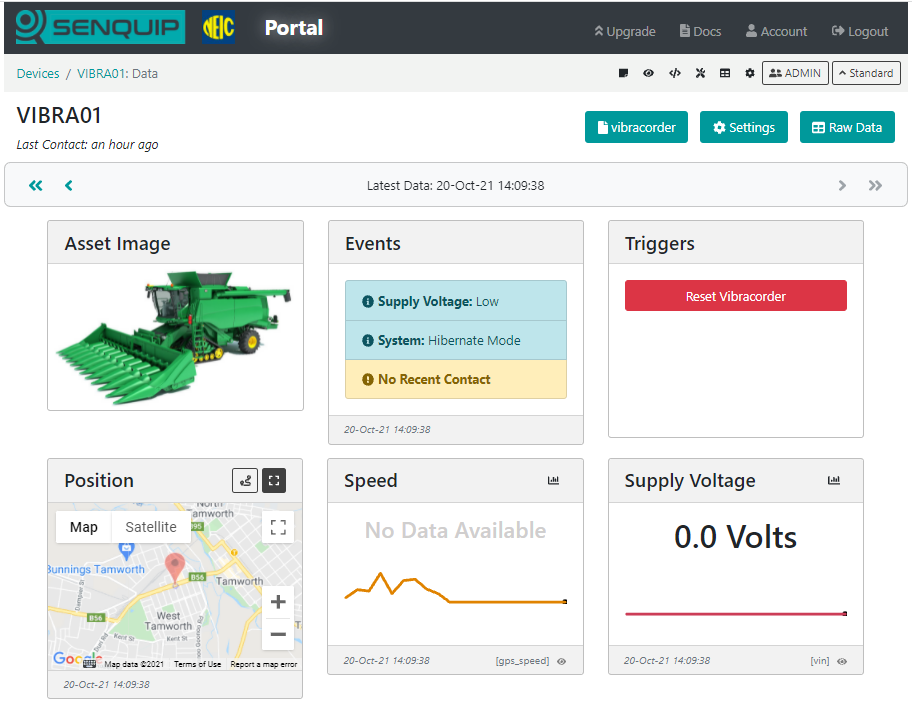
Only sensor interfaces that are enabled and have transmitted data recently will be displayed on widgets. Any exceptions currently being experienced will be shown in the Events widget. Information associated with the selected device such as the model number and firmware version will be shown in the Device Info widget.
Note
Any alerts, warnings or alarms currently present on the selected device will be shown in the Events widget on the dashboard.
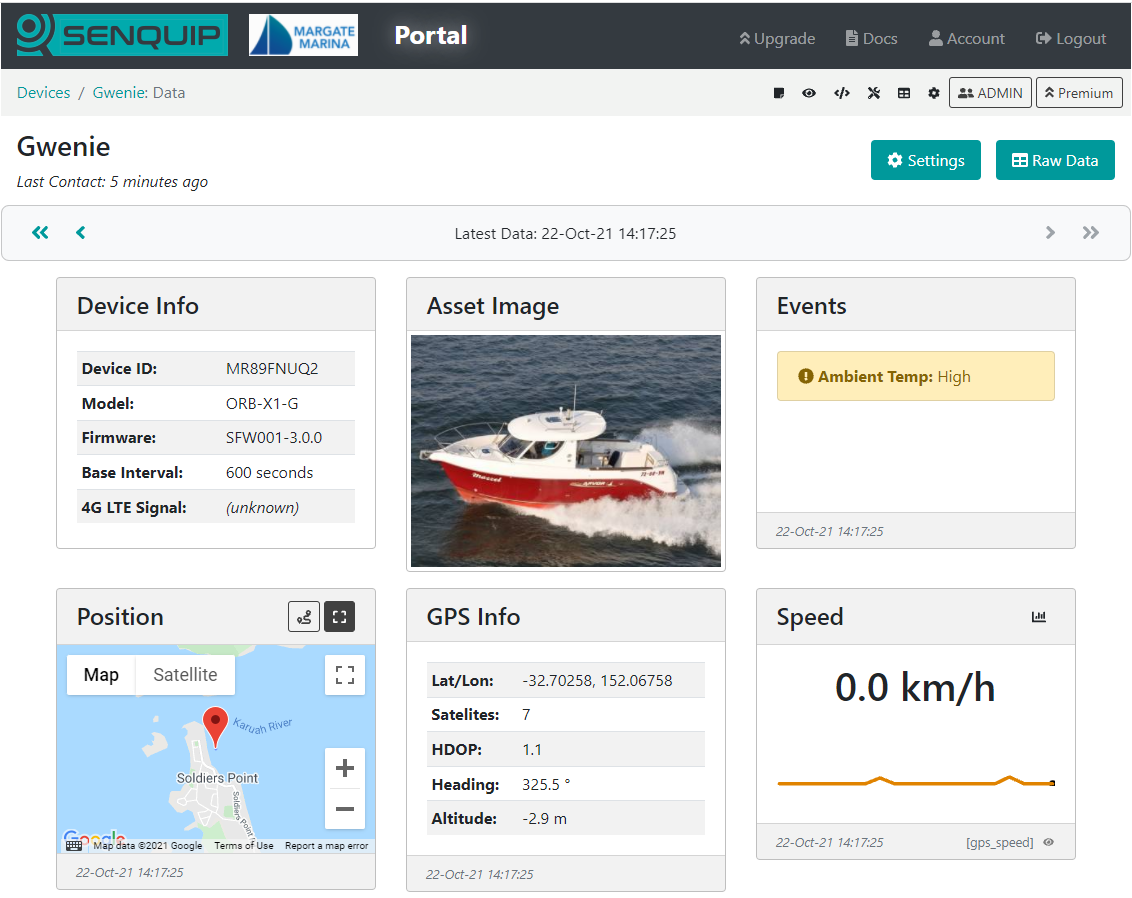
Senquip device dashboard
Click on the icon at the top right of each widget to show the data on a graph. Data on the graph can be selected for time periods of an hour, day, week, or custom. Click on a point on the chart to show values at that point.
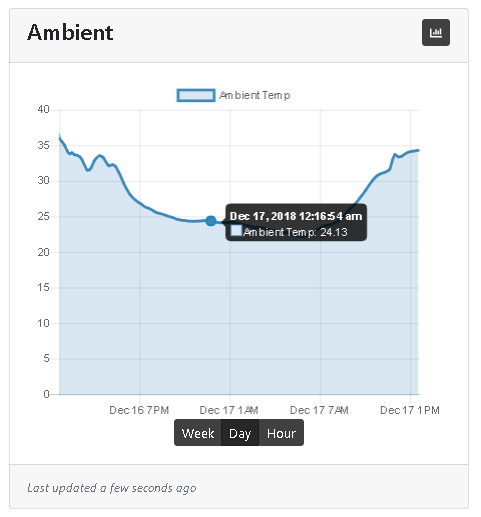
Example chart showing the days temperature
Data measured by Senquip devices can be visualised in various formats. To change the format in which data is visualised, press the eye icon on the bottom right of the tile. Formats available are:
Hidden - Hide the data if it is not relevant to the application
Trendline - The default graph that facilitates recognition of change. Allows the user to view longer term trends between date ranges.
Gauge - Useful when representing measurements that must exist within a range. Can be scaled so that the pointer is vertical under normal conditions. Warning and alarm levels can be set.
Digital - A simple ON or OFF display that shows the status of a measurement. The threshold at which the display switches from ON to OFF can be set.

Data visualisation in different formats
Buttons can be added to a dashboard that allow user to trigger events on remote devices. When the buttons are pressed, next time the remote device makes contact with the Portal, a user script is triggered to run on the remote device.
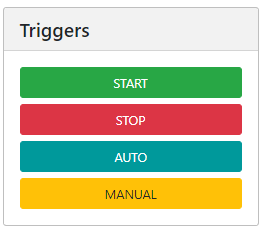
Buttons to trigger remote operations
From the device dashboard, the user can navigate to the settings, raw data, display settings and other pages.
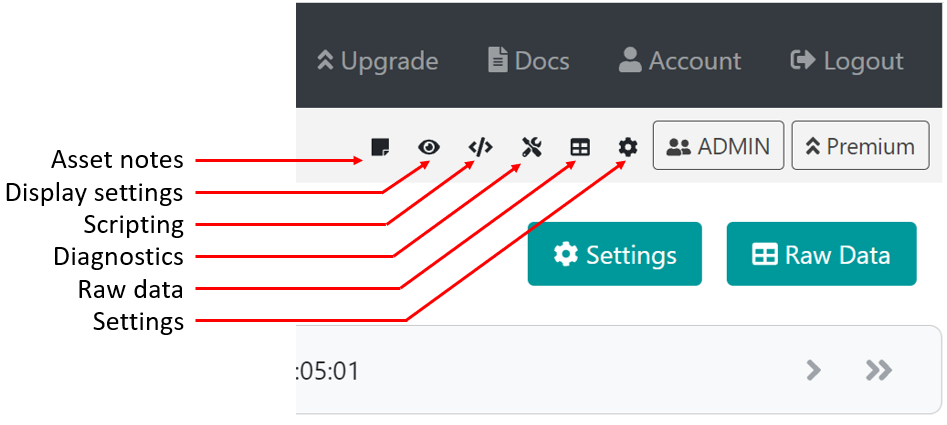
Navigate to device configuration pages
Asset notes allows the user to add an image of the system being monitored, add install images, other notes, and a company logo. Display settings allows the user to turn widgets on and off and re-order the widgets. The scripting icon passes the user to the JavaScript editor to enable scripts to be written for Senquip devices. Raw data allows the user to display and then download historic data in csv format. The settings icon takes the user to the device settings pages. Not all of the icons will be available to all users. For instance, the scripting icon will not show up for users who do not have access to scripting.
Dashboard with an image showing the system being monitored
Historical Data
To view or download historical data, press the Raw Data button on the top right of the dashboard. A table showing all the data associated with the selected device will be shown. To download the data, press the Export to CSV button. The data will be saved to your downloads folder. The downloaded file can be opened and manipulated with any spreadsheet tool.
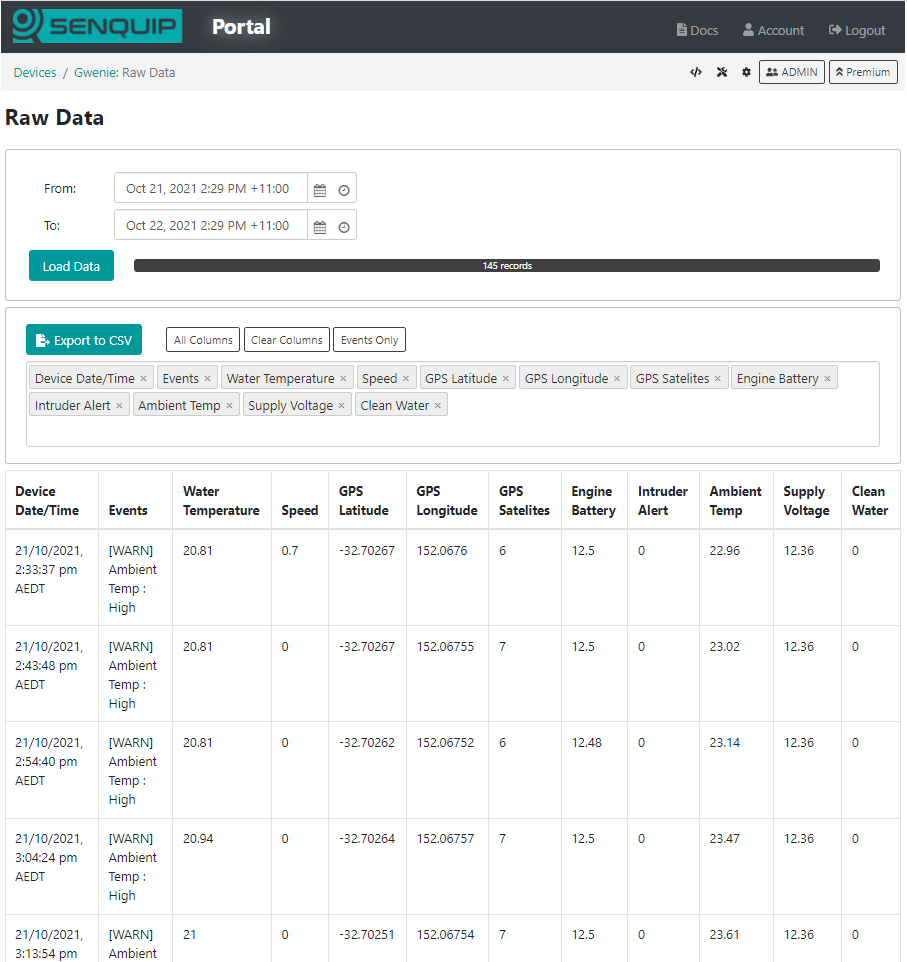
Data associated with the selected device shown in a table
Note
The timestamp in the timestamp column is in Unix Time; if you would like a GMT date and time field, enable the timestamp setting in endpoint settings.
User Administration
Use the Admin button to manage the users of each Senquip device. When a device is added to an account using the device ID and password, the user that added the device automatically becomes an admin for that device. Admin users can manage other user rights and have full permissions for the device. The different user types are detailed in the table below:
Allowed Permission |
Admin |
User |
Operator |
View |
|---|---|---|---|---|
View data |
Yes |
Yes |
Yes |
Yes |
Trigger device actions |
Yes |
Yes |
Yes |
|
View users |
Yes |
Yes |
||
Change device settings |
Yes |
Yes |
||
Add/remove users |
Yes |
Warning
Anyone who has the device ID and setup password can add the device to their account with Admin permissions.
Configuration via Senquip Portal
Settings associated with a Senquip device can be updated remotely via the Senquip Portal. To change the settings for a selected device, press the Settings button on the top right of the dashboard. The selected device settings will be shown and can be changed by clicking in the relevant fields. Once a setting has been changed, press the Save Settings button at the bottom of the page.
Senquip devices check for settings changes each time they make a connection to the Senquip Portal. If a device is set to transmit data once an hour, then the settings will be changed up to an hour after the changes have been made on the portal. If quicker changes are required, the device will need to be visited and the changes made via the integrated webserver in setup mode.
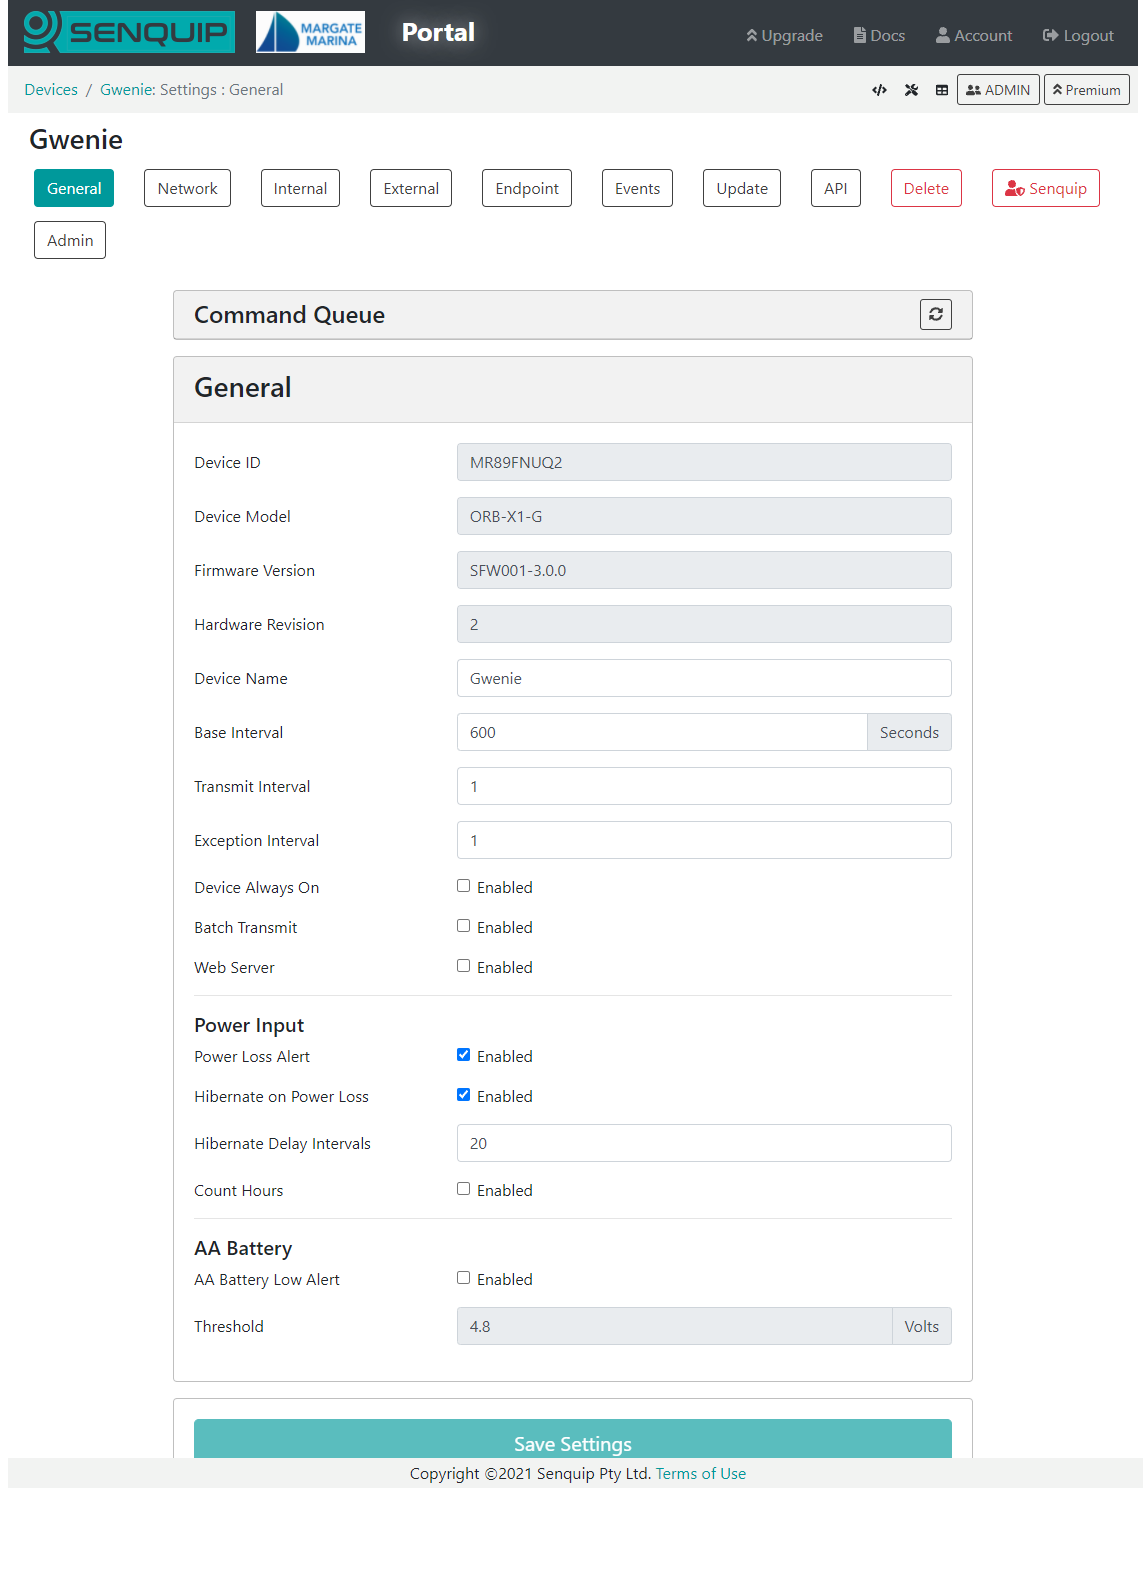
Remote update of device settings via the Senquip Portal
Note
In applications where power is available, a quicker transmit interval will mean that settings changes can be made more quickly.
Remote Firmware Updates
Senquip will routinely make firmware updates to enable new features, enhance security and fix bugs.
Device firmware can be updated via the Senquip Portal. To update the firmware, press the Update button on the settings page. You will be directed to a page asking for the firmware number. This number can be found in the Device Firmware Changelist on the Senquip website or through your preferred distributor.
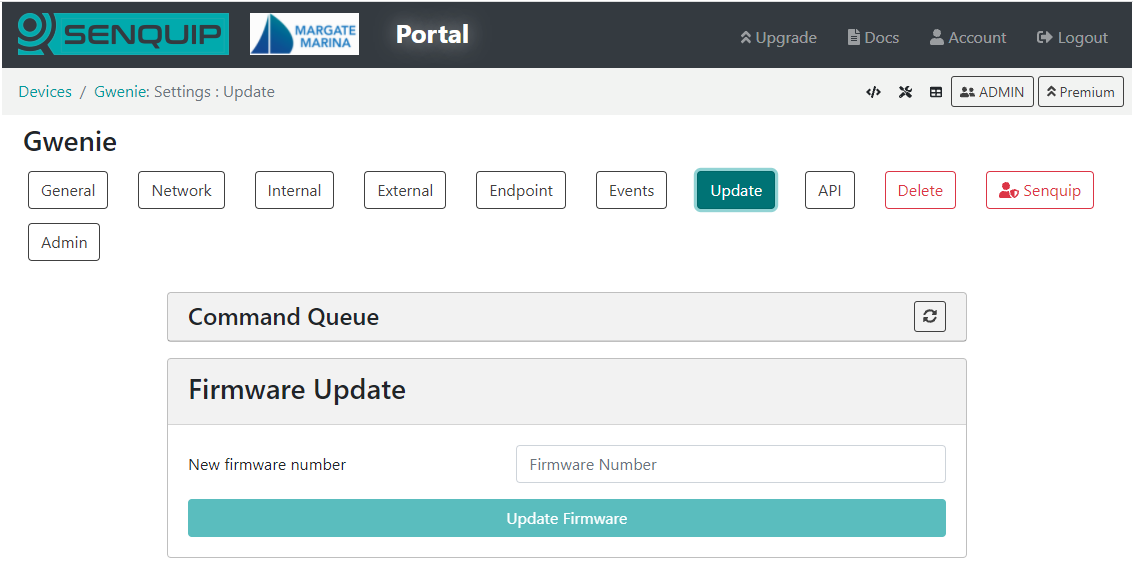
Remote firmware updates via the Senquip Portal
A Firmware Update typically takes about 5 minutes on Wi-Fi and 20 minutes on 4G LTE. During the update the green light will be off and the orange light will flash fast. Once the device has received the firmware update and is processing it, the lights may appear to freeze. This is normal behaviour. Please allow plenty of time for the device to finish the update and return to normal operation.
Note
There is always a risk that something may go wrong during a firmware update; it is not recommended that firmware be updated unless it is suggested by Senquip or a specific new feature is required.
Event Reporting
The Senquip Portal allows forwarding of alert, warning, and alarm events generated on a device to email or SMS endpoints. A Hosted plan is required for this feature. Use the Events page on the Senquip Portal to configure event reporting. Events can be configured to be sent once as they occur, or with a daily reminder.
Warning
Make sure to add no-reply@senquip.com to your safe senders list on you email client to prevent email events from going into spam or junk folders.
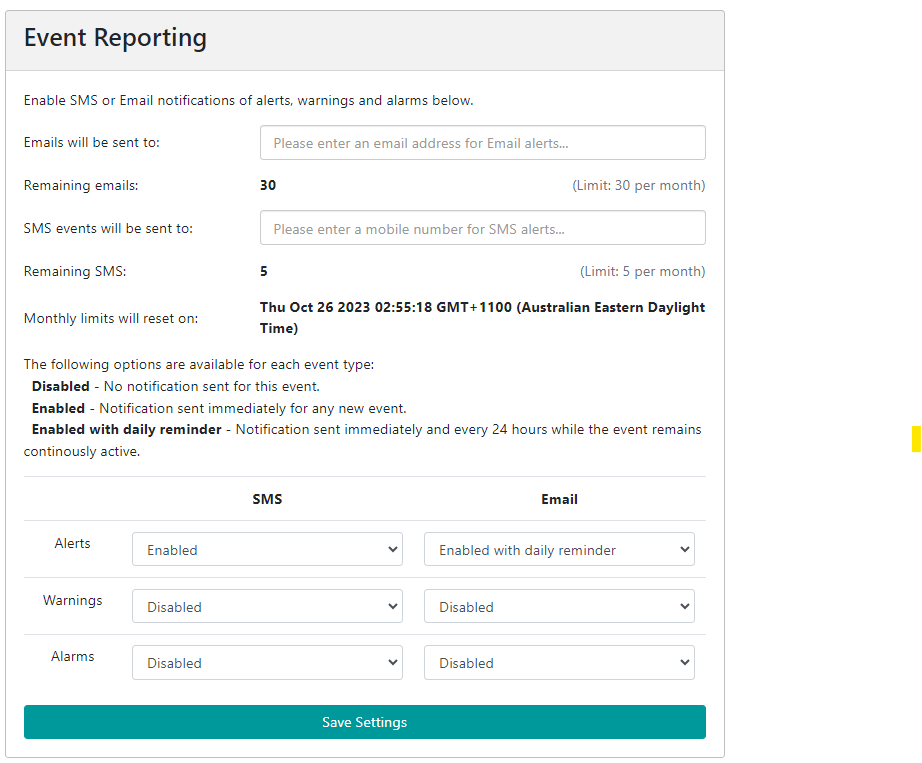
Configure event forwarding
If an event is current, and the event escalates, for example a warning turns into an alarm, the more severe event will be forwarded. If an event is current and it de-escalates, for an example, an alarm turns into a warning, the event will not be forwarded. If a type of event is current, and a new type of event occurs, the new event will be forwarded. For instance, if a high current warning is active and has been forwarded to email or SMS, and a high temperature warning becomes active, the high temperature warning will also be forwarded.
Creating Custom Widgets
Users can create custom widgets that display data graphically in a way that is meaningful to the user. In the example below, the pressure and temperature of each tire on an axle is shown. In the example, the pressure on tyre 2 has dropped and so the pressure field has turned yellow as a warning to the user.
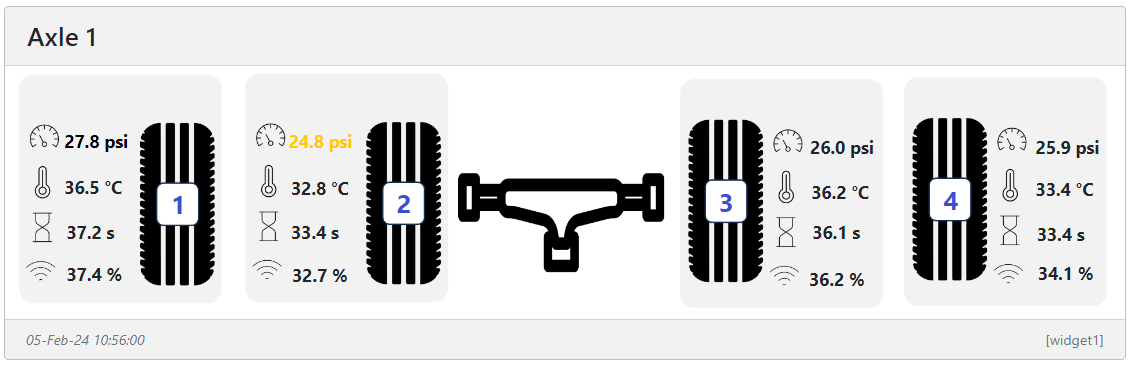
A graphical widget showing tyre status
To create a widget, select the Display Settings icon on the device data page and chose Add Custom Widget at the bottom left of the page. A new custom widget will be generated and you will be taken to the Widget Editor page to customise your widget. At the top of the Widget Editor page is your widget. It will default to a blank background with an example of how to display temperature shown. The text can be moved to a new location by clicking on it and dragging it.
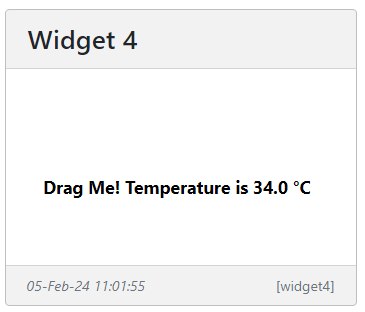
Default blank widget showing temperature
As an example, we will generate a widget that shows the level of water in a water cart. In the Widget Setup window, we get to name our widget with something meaningful to the user. We will name our widget “Water Cart” We can also set the width of the widget in units of a standard Senquip Portal widget. We will leave the width as 1 unit wide. A background colour can be selected and a background image loaded. We will use the Choose File option to load a background image of a water cart. We can choose to show the units associated with values displayed on our widget, or to leave the units off and make the units part of the background image of the text that is displayed along with the value. We will turn off showing units. Selecting Dynamic Colour Change automatically changes the colour of values and associated text when a warning or alarm is associated with that value. We will leave this on.
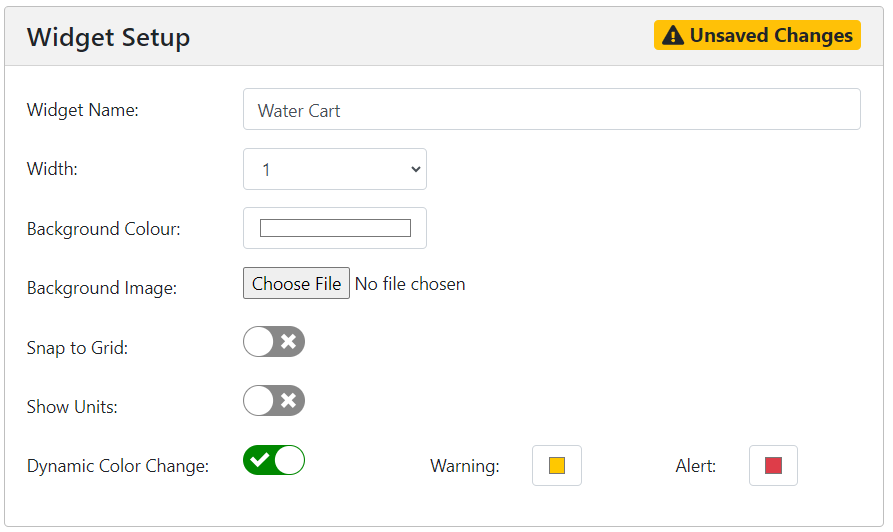
Settings for our water cart example
Note
Remember to save your changes.
The Widget Text window allows us to insert text and values on the image in the widget. When you created your widget, an example text entry was created “Drag Me! Temperature is ${data.ambient}”. In this example, the text “Drag Me! Temperature is” will be displayed along with the value of the ambient temperature. The most recent value of ambient temperature is inserted in the text string by using a dollar and curly bracket, followed by the data element, in this example ambient temperature, and a closing bracket “${data.ambient}”. In our example, we will create a script that has a custom variable cp20 called Water Level, and will use this in our example, inserting the unit kl in text as follows “${data.cp20} kl”.
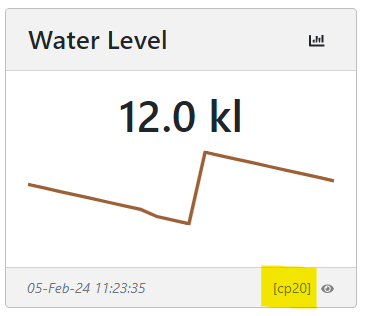
Water Level as shown on the device page.
We will choose Bold, 20px font size, and will make the default colour green.
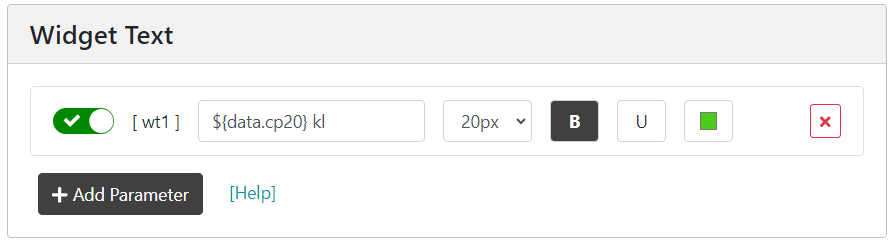
Water cart widget text settings.
Note
Because we have chosen Dynamic Colour Change, the colour of the text will change if there is a warning or alarm current on cp20.
Our widget now looks like the image below.
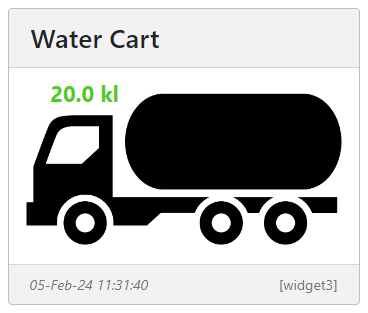
Water cart widget with water level shown in green.
We will now use the Widget Elements window to add a dynamic level indicator to the tank on the water truck. We will associate the level indicator with the water level, cp20, and will set the width, height, and radius to match that of the tank on the water truck image. Since the water level parameter created in the script has a range of 0 to 20, we will set the minimum and maximum levels of the indicator to 0 and 20.
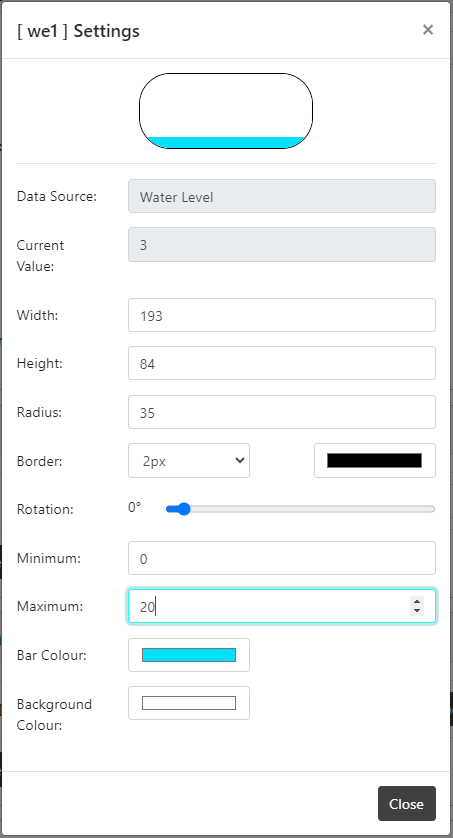
Settings for water cart level element
We could also add a status indicator light to the image by adding a status indicator element. Status indicators can be associated with data values and can be set to change colour as the data value drops below a threshold.
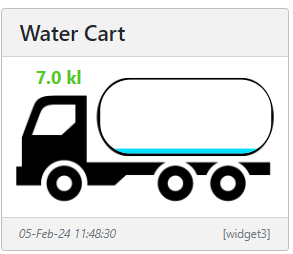
Completed water cart widget
Once saved, the water cart widget will appear on the device page alongside all the other enabled widgets.
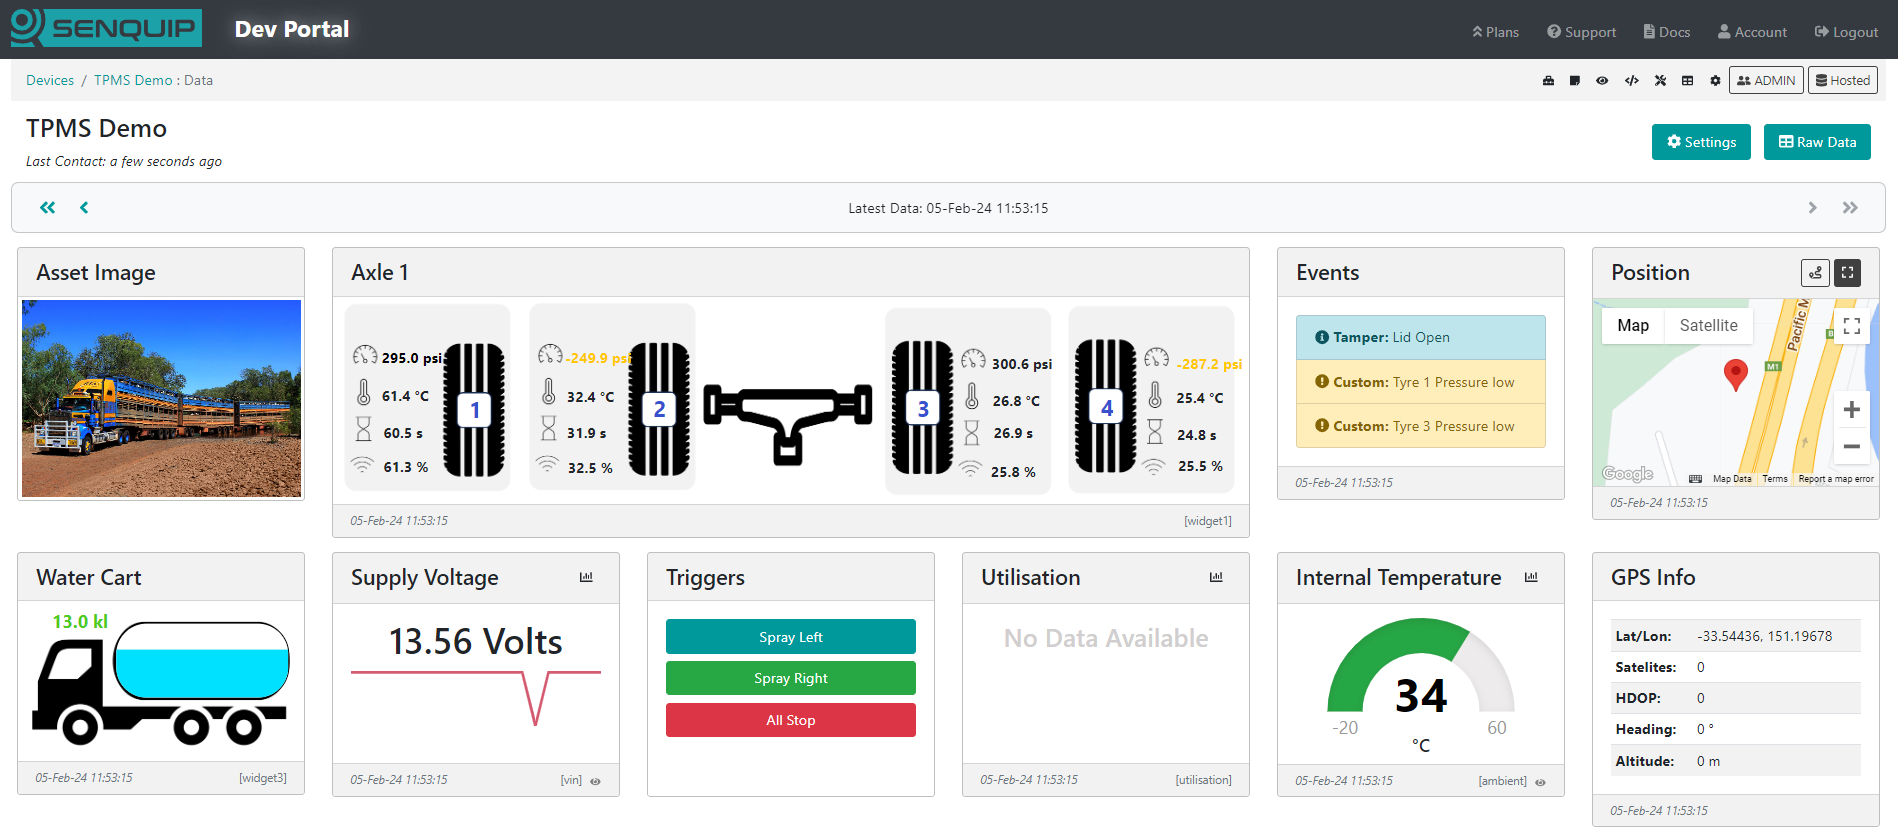
Water cart widget shown on the Senquip Portal
To edit the widget, go to the Display Settings page and select the widget by clicking on the widget name.
Sizing of widget images
The width of a custom widget can be chosen as 1 to 4 standard widgets in width. The height of the widget is determined by the size of the image uploaded. In the water cart example above, the image was scaled to result in a widget that is the same height as most of the other standard widgets on the device page. This makes for a neat and consistent looking display. To create a widget the same height as most widgets on the Senquip Portal, use the following ratios for the background image.
Note
The image does not have to be these exact sizes as the width will auto scale. The ratio does however need to be correct.
Widget width |
Image width |
Image height |
Ratio |
|---|---|---|---|
1 |
320 |
178 |
1.8 |
2 |
670 |
178 |
3.8 |
3 |
1020 |
178 |
5.7 |
4 |
1370 |
178 |
7.7 |
Creating Custom Charts
Users can create custom line, area, and scatter charts with multiple axis, and multiple series. In the example below, the number of particles of a particular size in oil is shown on a stacked area chart, with the total of the stack indicating the total number of particles.
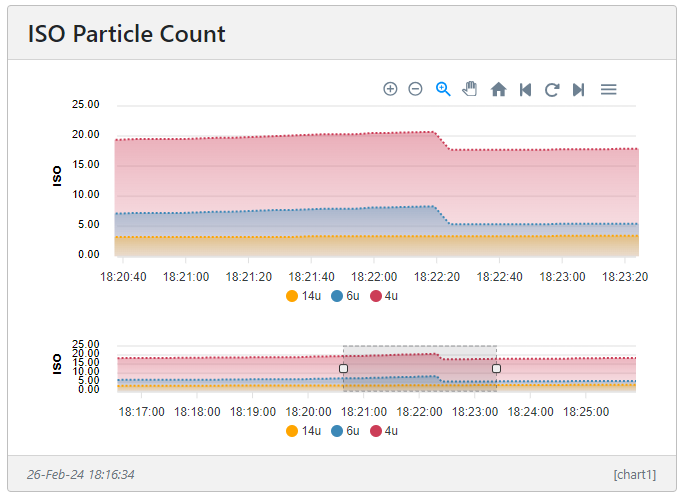
Brushed area chart showing particles in oil
Note
To speed up render time, all charts are downsampled to show 1000 points across the chart. The algorithm used to downsample the chart data has been selected to retain as many of the features of the original data as possible. It is however possible that details may be missed in a highly compressed timeline.
To create a custom chart, select the Display Settings icon on the device data page and chose Add Custom Chart at the bottom left of the page. A new custom chart will be generated and you will be taken to the Chart Editor page to customise your chart. At the top of the Chart Editor page is your custom chart. It will default to a simple chart with no series.
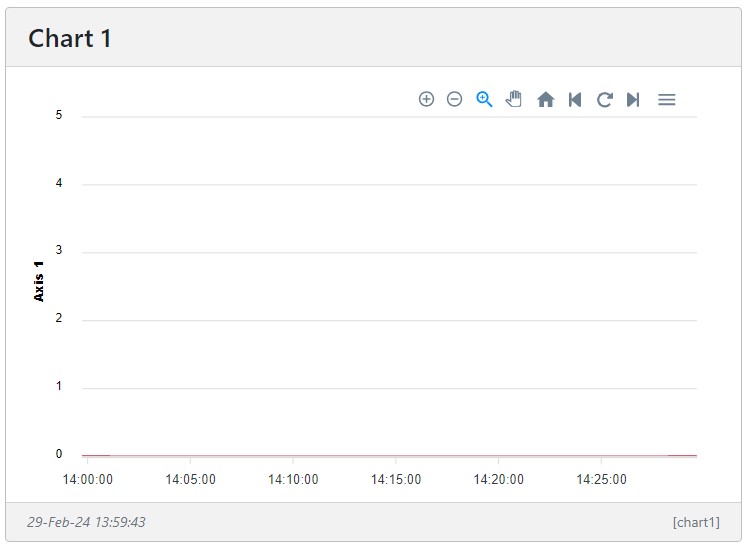
Default custom chart
We start by giving the chart a name, in this example, we will generate a chart showing temperature and pressure in a compressor and so we will call the chart “Compressor 2D”. We will choose a Line chart, and will give the chart a size of 2 widgets wide by 2 widgets high. We have chosen a time range of 10 minutes. If we had selected Brushed Chart, a magnifying window below the chart would appear that can be dragged left and right to scroll through chart data. The earlier oil particle chart is an example of a brushed chart. If we had selected a Stacked Series, the values of the various series would be summed. The example of the oil particle chart is a stacked chart.
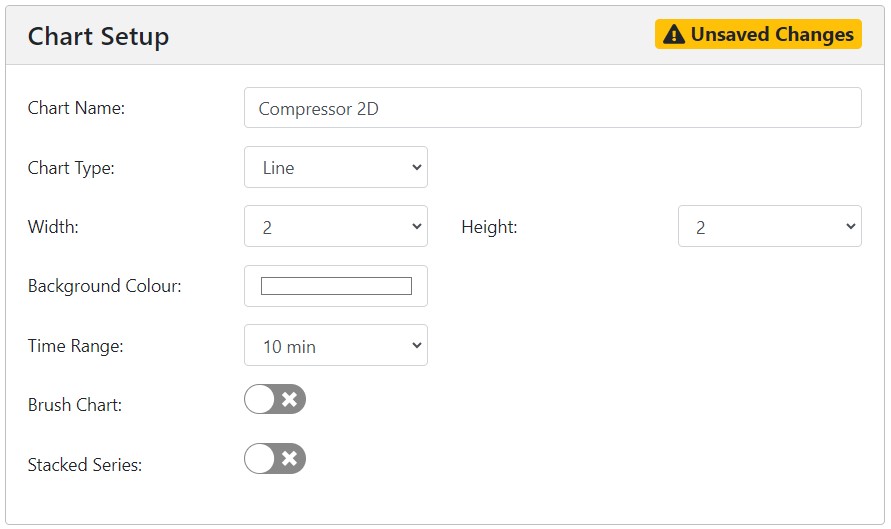
Custom chart settings
We will now add the axis to the chart. We add 1 axis for temperature and 1 axis for pressure. We have added custom minimum and maximum values for the axis but if we had left them blank, axis values would have been assigned based on the available data. The tick interval has been left blank and will be calculated automatically. One decimal place has been selected for the axis labels, and a colour has been assigned to each axis. Custom axis settings are disabled if the Brush Chart option is selected. Only a single axis can be added if Stacked Series is selected.
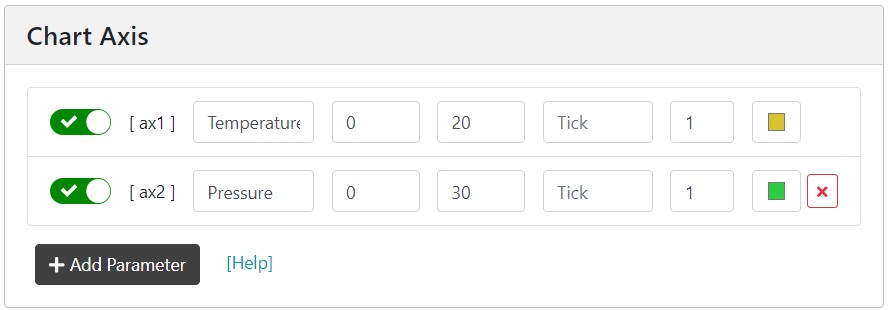
Custom chart axis
We will now create a series and will assign an axis to each series. We first select the axis associated with the series. We then select a measurement. In our example, we will add compressor temperature and internal device temperature to the Temperature axis and pressure to the Pressure axis. We have selected the line type as Solid, have selected a line width of 2, and have chosen a colour for each series.
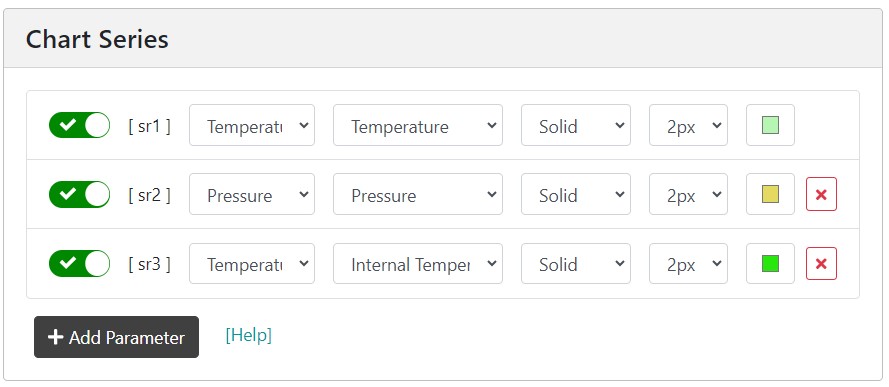
Adding series to a custom chart
Note
Remember to save your settings.
We have now generated our first chart.
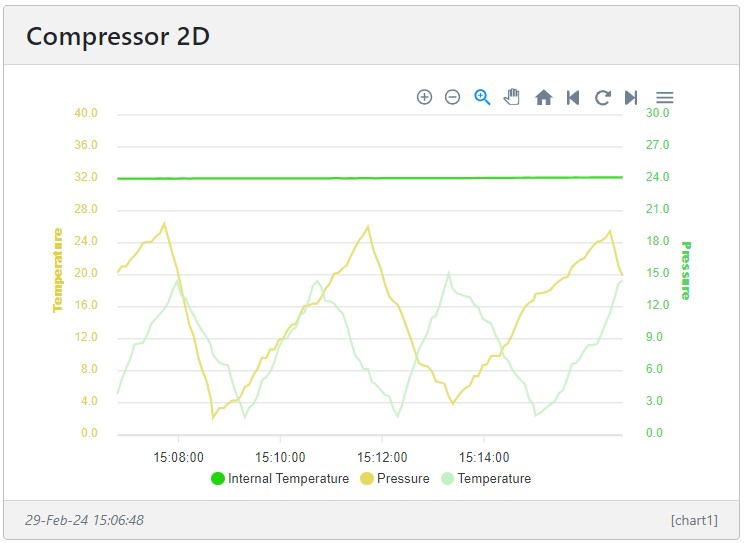
Example chart showing generator temperature and pressure
The charts offer controls for zooming, panning, loading previous and new data, and enhancing a zoomed area. The enhance option is provided so that the user can zoom into an area and then select the option to load more data from the server to enhance the chart where the downsizing algorithm may have smoothed detailed features.
Management and Hosting on the Senquip Portal
The Senquip Portal offers hosting of data, a data visualisation dashboard, firmware upgrades, and device management including remote configuration and scripting. Every Senquip device purchased comes with a managed plan for the life of the product (10 years). Managed plans allow remote configuration and scripting on the Senquip Portal. Users have the option of purchasing a hosted plan to enable data hosting and data visualisation on the Senquip Portal. Hosted plans are available on a monthly, yearly, or lifetime basis (10 years), and can be purchased directly off the Senquip Portal or through distributors.
Basic
Managed plans are most suitable for users who are hosting their data on their own server and have their own dashboards. Features of the management plan include:
Configure devices from the Senquip Portal
Connection to a private server
View current data
5 Minute updates to the Senquip Portal
1 Day of data storage
Device Scripting
Access for 3 users
Firmware updates
Hosted
Hosted plans are for users who will use the Senquip Portal to store and visualise their data. Features of the hosted plan include:
Configure devices from the Senquip Portal
Connection to a private server
View current and historical data
5 second data update limit
2 years of data storage
Device scripting
Senquip Portal access for 50 users
Firmware updates
Export raw data
Trigger remote actions
Create custom data widgets
Create custom charts
Device to device messaging
300 email alerts per month
100 SMS alerts per month
Senquip Cloud API access
AEMP API access
Note
Every device includes 90 days of hosted access from the date of activation.
For the most up to date feature list and to purchase a hosted plan, please visit the Senquip Portal or contact your preferred distributor.