The Senquip Portal is a secure, cloud-based platform hosted on Amazon Web Services (AWS), designed to provide powerful management and visualisation tools for your Senquip devices.
The Portal enables users to:
View dashboards that display data across groups of devices
Access detailed device pages showing real-time and historical sensor data
Perform device management including configuration and firmware updates
Handle user management with role-based access control
Maintain long-term data storage for historical analysis and compliance
Manage events with configurable warnings and alarms
Manage device subscriptions
The Senquip Portal provides a streamlined and scalable interface used to monitor, manage, and respond to field data from anywhere in the world.
If you do not have an account on the Senquip Portal, you will need to create one. There are no charges for creating an account on the Senquip Portal and a credit card is not required.
A verification email will be sent to the email address provided. Click on the link in the email to verify your account. The email address must be verified as important system updates, alerts, warnings, and alarm messages will be sent to the email address.
Select a name for your group that will be meaningful to the indented user group and press Create. The group name can be changed later in the Group Settings.
By pressing the Add Device button and entering the device ID. If you are adding a new device to your account, you will be required to enter the setup password.
Use the search bar at the top of the page to find devices and groups. Search by group name, device ID, or device name. The Favourites button can be used to identify the last few devices and groups accessed, and to mark devices and groups as favourites.
The Group Users option allows users to be added or removed from a group. Where users are added, they must be allocated appropriate permissions for the group.
Allowed Permission
Admin
User
Operator
View
View data
Yes
Yes
Yes
Yes
Trigger device actions
Yes
Yes
Yes
View users
Yes
Yes
Change device settings
Yes
Yes
View or edit script*
Yes
Yes
View server log
Yes
View device passwords
Yes
Add or remove group users
Yes
Add or remove group devices
Yes
Import and export settings
Yes
Note
If you have created a private group and want to share that group, you will need to have administrator permissions for all devices in that group.
Note
Users should be added with the minimum permission level required to perform their function.
Warning
Anyone who has the device ID and setup password can add the device to their account with Admin permissions.
In the example below, Senquip Test0 is the owner of the group and has Administrator access to all devices in the group. Senquip Test1 has been added to the group with permission level User.
Bulk configuration of devices allows for settings, firmware, configuration, alerts, and files upload functionality across many devices at the same time.
When applying settings via the Groups feature, changes will be pushed to all selected devices simultaneously. This is a powerful tool, but it carries significant risk if configurations have not been properly validated.
Before deploying a Group update:
Ensure that all devices listed are intended to receive the same configuration.
Double-check settings such as network SSID, endpoint details, and peripheral configurations.
Always test the configuration on a single device first to confirm safe behaviour.
As shown in the Portal, users must acknowledge the following before applying the update:
Bulk configuration is efficient, but unforgiving. Please review all settings carefully - especially when managing devices in remote or critical environments.
The Bulk Firmware Update tool allows firmware to be updated across multiple devices simultaneously.
Devices are grouped and filtered based on their firmware family (e.g., SFW001, SFW002, SFW003).
A selection button at the top of the interface ensures that only devices within the same base firmware can be chosen.
Note
You cannot update between different firmware numbers.
Device configuration files contain device settings, scripts, Senquip Portal display settings, asset notes, notification settings, and API settings. The Bulk Configuration Import feature allows configuration files that have been exported from a device to be imported into multiple devices at once.
Access this feature from the Group Settings > Bulk Configuration Options menu by selecting the Import Configuration option.
After selecting a previously exported configuration file, you have the option to
Update Firmware to Match Import File - update the device firmware before importing the configuration file
Reset to Factory Defaults Before Importing - removes all setting from the device before applying the settings in the configuration file
Note
Configuration files only contain settings that are different to the defaults. If other settings have previously been changed on the device, these will not be affected by the import. It is therefore suggested that devices be returned to factory default before a configuration is imported.
Note
If the imported configuration file does not contain network settings, the device will retain existing network settings.
After a user confirmation, the results of the bulk configuration import are shown.
Warning
If the configuration file originates from a different firmware, for example SFW002 from an ORB being applied to SFW003 on a QUAD, device settings may not be compatible.
User files, typically csv or txt, can be uploaded to multiple devices at the same time. These files may be used in scripts to linearise sensors, update geofences, or a host of other applications.
After choosing a file, the results of the file upload are shown.
Senquip Vision is a powerful, customisable dashboard that enables businesses to monitor and analyse key operational metrics across a group of devices. Designed for management, maintenance and operational users, it provides a clear and intuitive interface for tracking real-time data, historical trends, and device status, all in one place.
The following are key elements of a Senquip Vision Dashboard:
A view is a named dashboard: one summary table, an optional map, and any number of charts and headline numbers, together with a period. Users can create different views for management, operational, maintenance and other functions. When a group has no views, a default view with a table and map is shown.
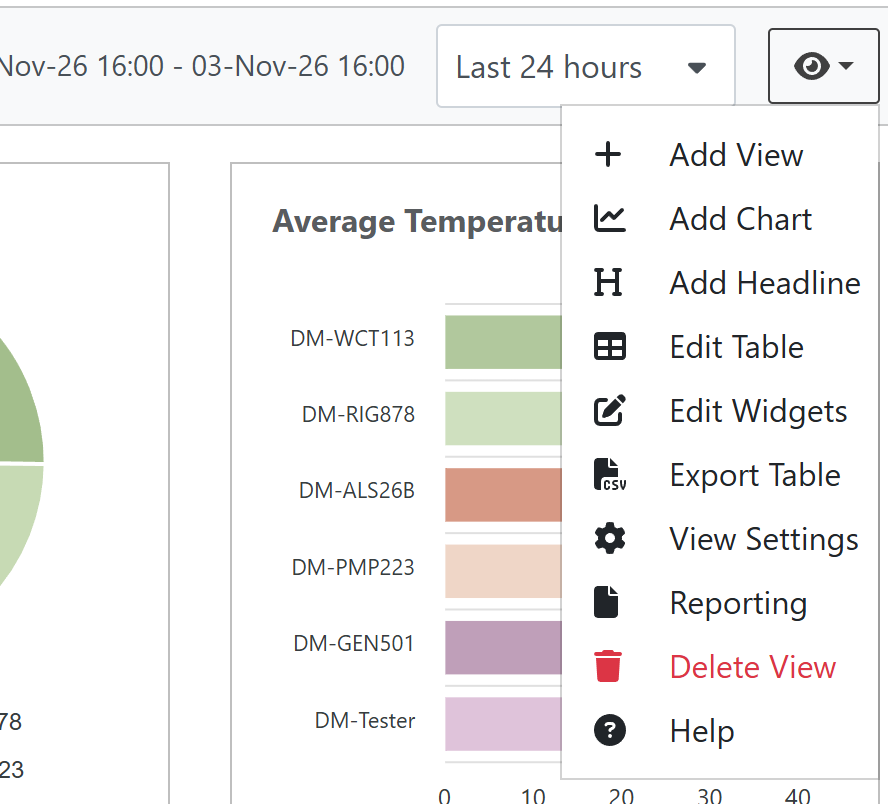
Only users with the Admin or User role on the group can change views. Other users see only Export Table and Help.
Adding a view
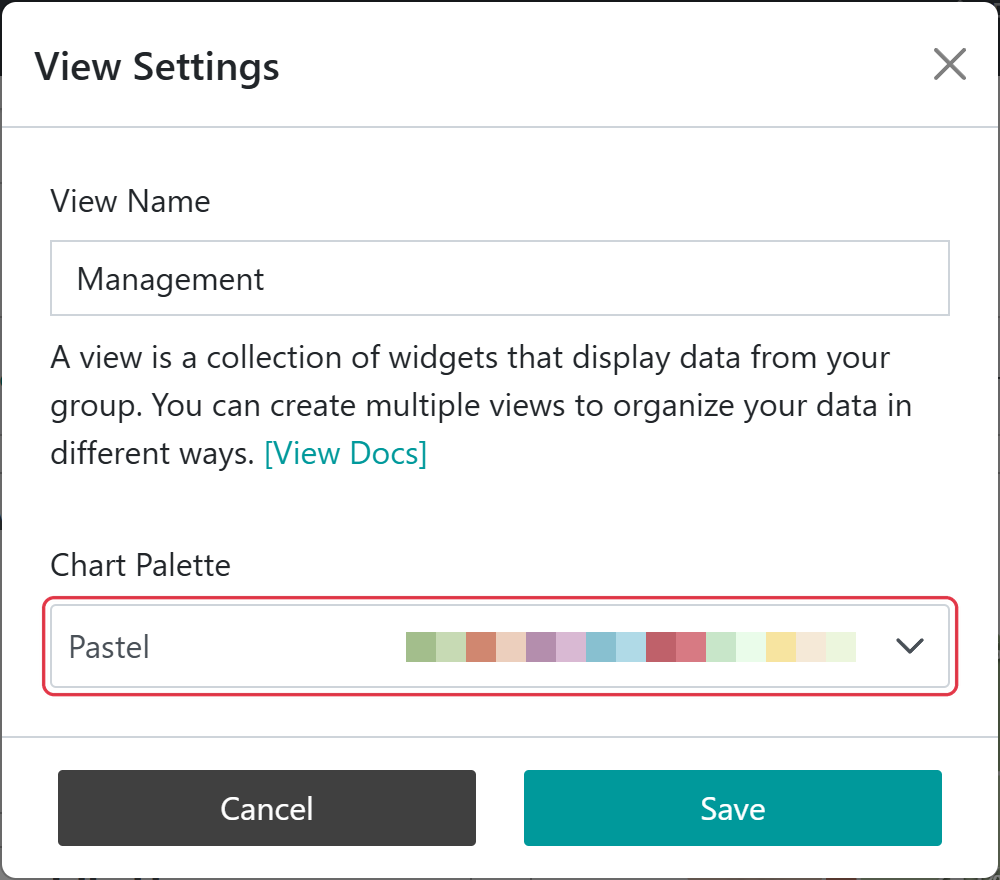
Select Add View, enter a View Name, and choose a Chart Palette: the set of colours used for devices on the view’s charts. A new view starts with a summary table and a map and covers the last 7 days, and the table editor opens so that you can choose its columns straight away. View Settings opens the same window to rename a view or change its palette later.
With the Default palette, each device keeps the same colour on every chart. With any other palette, colours are assigned by each device’s position in the group, so adding or removing devices can change them.
A period of interest can be selected that aligns with the function of the view. For example, when considering rainfall data, month to date may be the most meaningful period. When considering productivity, the last 7 days may be more useful.
When a period is selected, calculations on data (metrics) are performed over that time, and data is displayed for that period.
Period
What it covers
Last 24 hours
Rolling window of 24 hours.
Last 7 days
Rolling window of 7 days.
Last 30 days
Rolling window of 30 days.
Week To Date
From 00:00 on Monday until now.
Month To Date
From 00:00 on the 1st of the month until now.
Custom Range
Your own From and To times, or one of the quick buttons: Previous 24 hours, Previous 7 days, Previous 30 days, Previous Week or Previous Month.
Metrics are calculated hourly, so every period ends at the start of the current hour. The range is shown beside the period selector.
Trend arrows compare the period with the previous period: the same length of time immediately before it. For Week To Date this is the same days of the previous week, and for Month To Date the same days of the previous month.
Note
When an Admin or User chooses a period, it is saved as the view’s period for everyone. A Custom Range is not saved with the view; it is kept in the page address, so you can bookmark it or share the link.
Note
The period selector is only shown when at least one widget on the view uses a metric calculated over the period. A view that only shows Latest values has no period.
Every column in the summary table, every chart and every headline number shows a metric: a value worked out from one measurement over the view’s period. Each one is set up with two choices:
the Data Source, which is the measurement, such as Fuel Level or Run Hours
the Metric, which is how that measurement is worked out over the period, such as its lowest value or its average
Metrics are calculated at the end of each hour for the data collected in that hour, and are then combined for the selected period.
Choosing a metric
If you want to know…
Use
What is it reading now?
Latest
How low or how high did it get?
Minimum or Maximum
What was its typical level?
Average
How much did a counter go up, such as engine hours or an odometer?
Difference, or Accumulation if the counter can reset
How much was used or produced, from a rate such as kW or litres per second?
Integral
How many pulses, events or amounts were reported?
Total
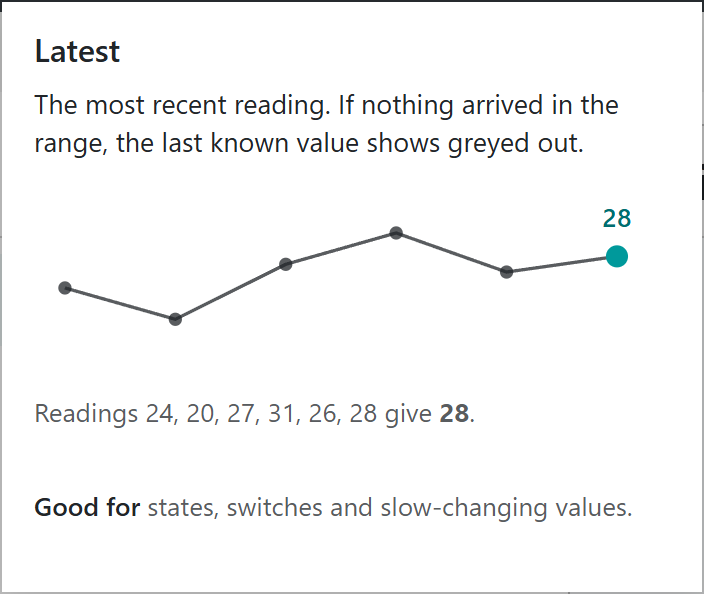
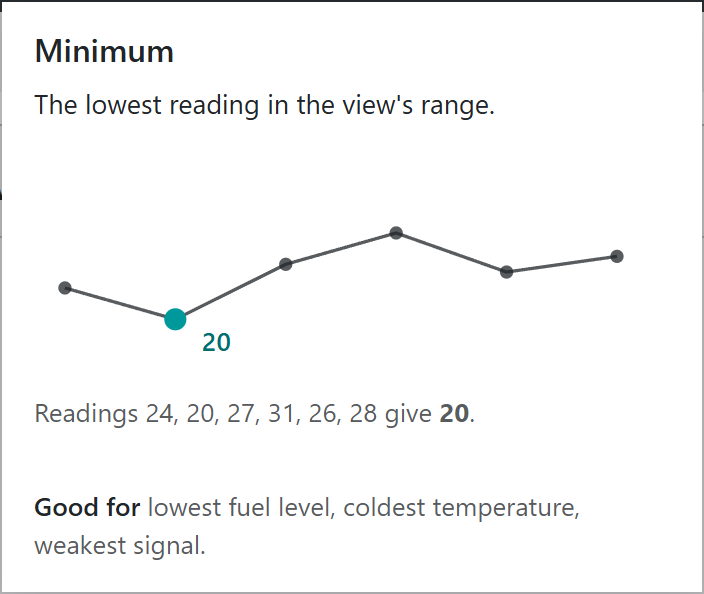
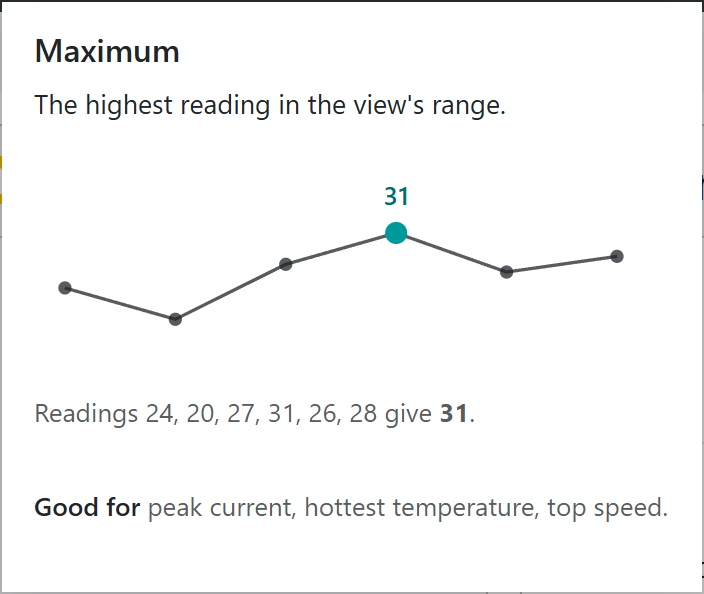
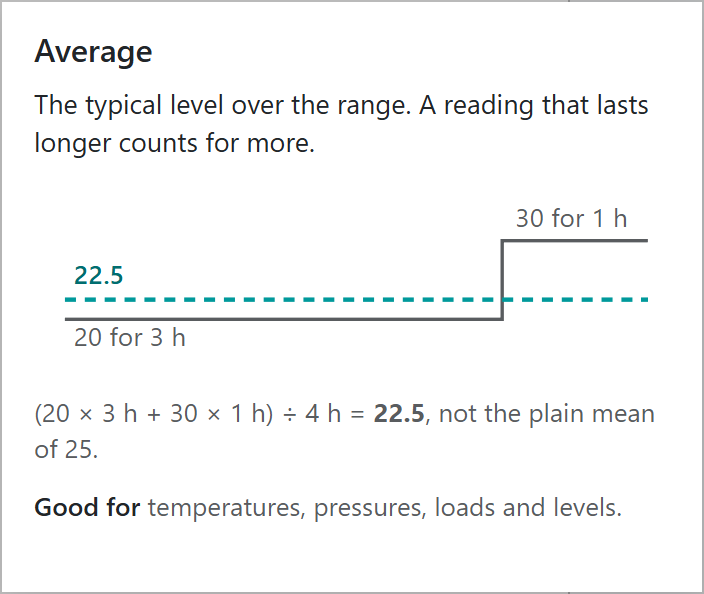
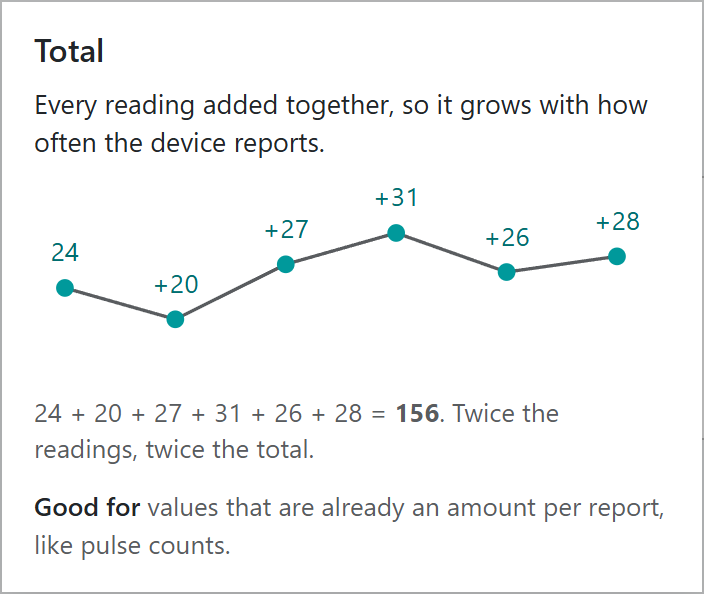
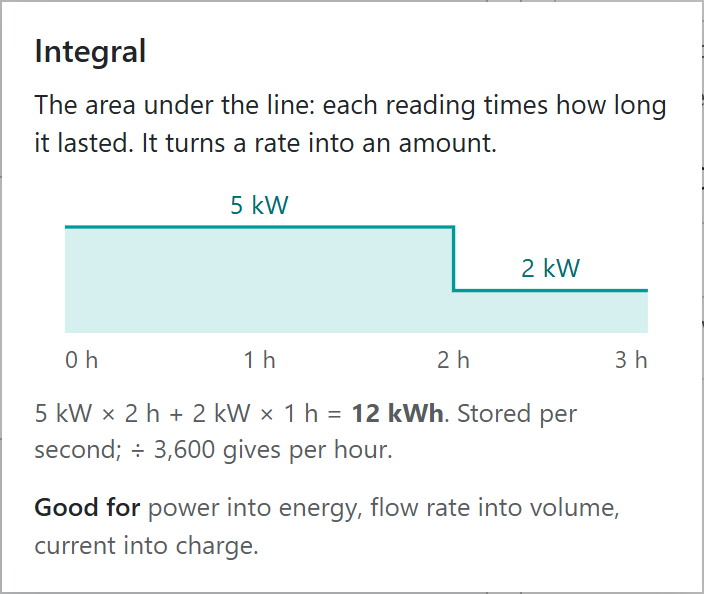
Select the information icon beside Metric in any editor to see how a metric works. The cards below are the same ones the editors show. Most use the same six readings, 24, 20, 27, 31, 26 and 28, so you can compare what each metric makes of them. In the editor, the card also shows the metric’s value for one of your own devices.
Not every metric is offered for every measurement. For example, states and GPS positions only offer Latest. Charts offer every metric except Latest.
The most recent reading. Of the readings 24, 20, 27, 31, 26 and 28, the last is 28, so Latest is 28.
Example applications:
Current engine hours
Current tank level
Current machine state
Note
In the summary table, if a device has not sent the value recently, its last known value is shown greyed out. Hover over it to see when it was received. A Latest headline only counts devices whose latest message includes the value.
The lowest and highest single readings in the period. Of the readings 24, 20, 27, 31, 26 and 28, the Minimum is 20 and the Maximum is 31.
Example applications:
Lowest tank level so far this month
Lowest temperature in the last 24 hours
Highest engine temperature this week
Highest engine speed over the past 24 hours
Note
If no readings are available in the period, no value is shown. If only one reading is available, the minimum and maximum are the same.
Average
Average weights each reading by how long it lasted
The typical level over the period. Average is a time weighted average: each reading counts for as long as it lasted, until the next reading arrived. In the card, the value was 20 for 3 hours and then 30 for 1 hour, so the average is (20 × 3 + 30 × 1) ÷ 4 = 22.5. A plain mean of the two readings would say 25, overstating a level that was only high for an hour.
This makes Average reliable when readings arrive irregularly. In the example below, a dam level is monitored and samples arrive sporadically. Each sample is assumed to hold until the next one, and the average is the area under the line divided by the period. The first sample, 2-Jan-2025 0:00:00, represents midnight on the 1st of January, and the last, 1-Feb-2025 0:00:00, represents midnight on the 31st of January.
Time weighted average works well where there are missing samples
Example applications:
Average dam level over a month
Average engine load or temperature over a shift
Note
If there is no reading at the start of the period, the last reading from before the period is used. If there is no earlier reading, the first reading is assumed to have been the value from the beginning of the period.
Every reading in the period added together: 24 + 20 + 27 + 31 + 26 + 28 = 156. Because each reading is added, the total depends on how often the device reports: twice as many readings give twice the total. Total is the right choice only when each reading is already an amount for its report, such as the rainfall since the last report or a count of pulses.
In the figure below, daily rainfall is totalled for the month. The first sample, 2-Jan-2025 0:00:00, represents midnight on the 1st of January, and the last, 1-Feb-2025 0:00:00, represents midnight on the 31st of January.
Number of times the pressure dropped below a threshold
How many times a gate has been opened
Totalling historic data in the Senquip Portal simplifies device configuration, as the device does not need to keep a running total itself.
Warning
Do not use Total for a rate, such as litres per second, or for a counter, such as engine hours. Use Integral for a rate, and Difference or Accumulation for a counter.
Note
If no readings are available in the period, no value is shown.
Integral
Integral multiplies each reading by how long it lasted
The area under the line: each reading multiplied by how long it lasted. Integral turns a rate into an amount. In the card, a load of 5 kW for 2 hours and then 2 kW for 1 hour used 5 × 2 + 2 × 1 = 12 kWh of energy. Similarly, a flow meter’s 4 to 20 mA signal, scaled to litres per second, integrates to the total volume pumped.
Readings are multiplied by time in seconds, so the result is in the measurement’s unit multiplied by seconds: power in kW integrates to kW·s. Divide by 3,600 for kWh. The Add Columns list shows example values both ways.
Example applications:
Energy from power
Volume from flow rate
Charge from current
Note
The integral uses the same approach as Average, without dividing by the period. For a result in sensible units, the measurement should be a rate per second, such as litres per second. If your sensor reports per minute, divide by 60 in the sensor settings or in a script.
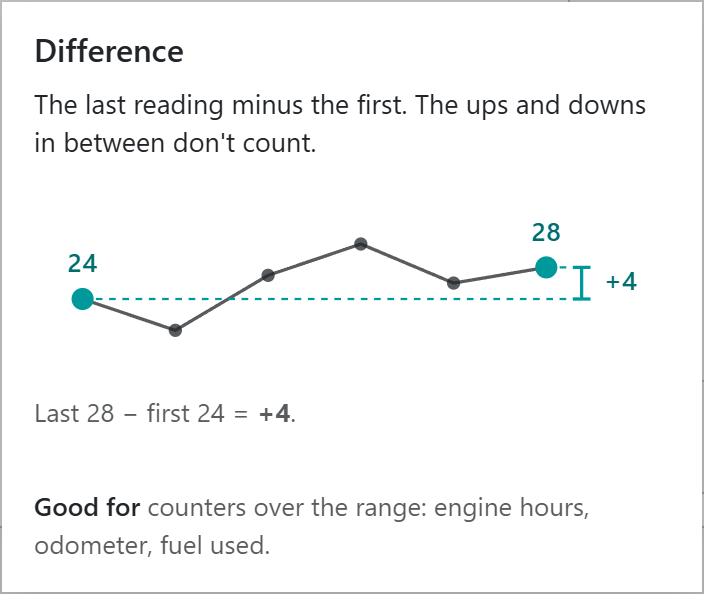
The last reading in the period minus the first. The ups and downs in between do not count. Of the readings 24, 20, 27, 31, 26 and 28, the difference is 28 − 24 = +4.
Difference suits counters that only go up, such as engine hours or an odometer: the difference is how much the counter rose during the period.
Example applications:
Engine hours run this week
Distance travelled this month
Change in dam level over the past month
Note
If no readings are available in the period, no value is shown. If only one reading is available, the difference is zero. If the counter is reset during the period, the difference can be negative; use Accumulation instead.
Accumulation
Accumulation adds up every rise and ignores resets
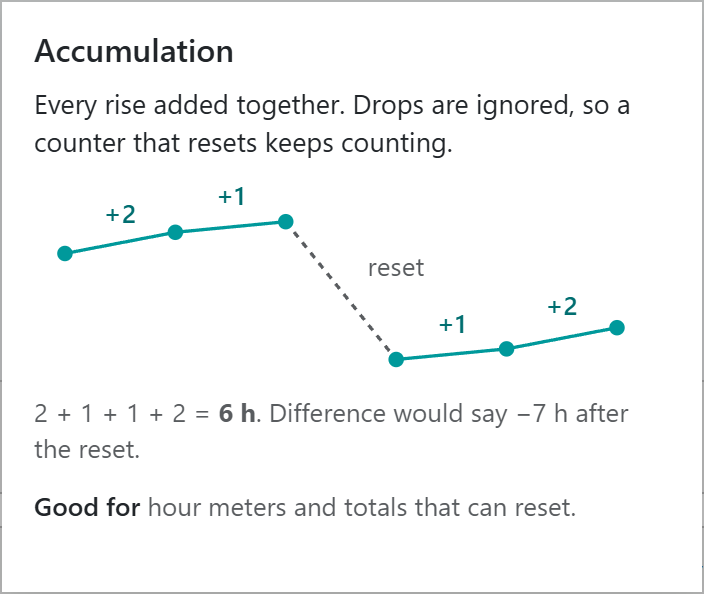
Every rise added together. Drops are ignored, so a counter that resets keeps counting. In the card, an hour meter rises by 2 and then 1 hour, is reset to a lower value, then rises by 1 and 2 hours. Accumulation is 2 + 1 + 1 + 2 = 6 hours, while Difference would say −7 hours because the last reading is lower than the first.
In the figure below, engine hours are read from an hour meter. As the hour meter rises, so does the accumulation. When the hour meter is reset, the accumulation does not drop and continues to climb.
Accumulation keeps climbing when the source value is reset
Example applications:
Engine run time where the hour meter may be replaced
Idle time where the counter resets when the engine is turned off
Distance travelled from a trip meter
Total flow where the flow meter may be zeroed
Note
If no readings are available in the period, no value is shown.
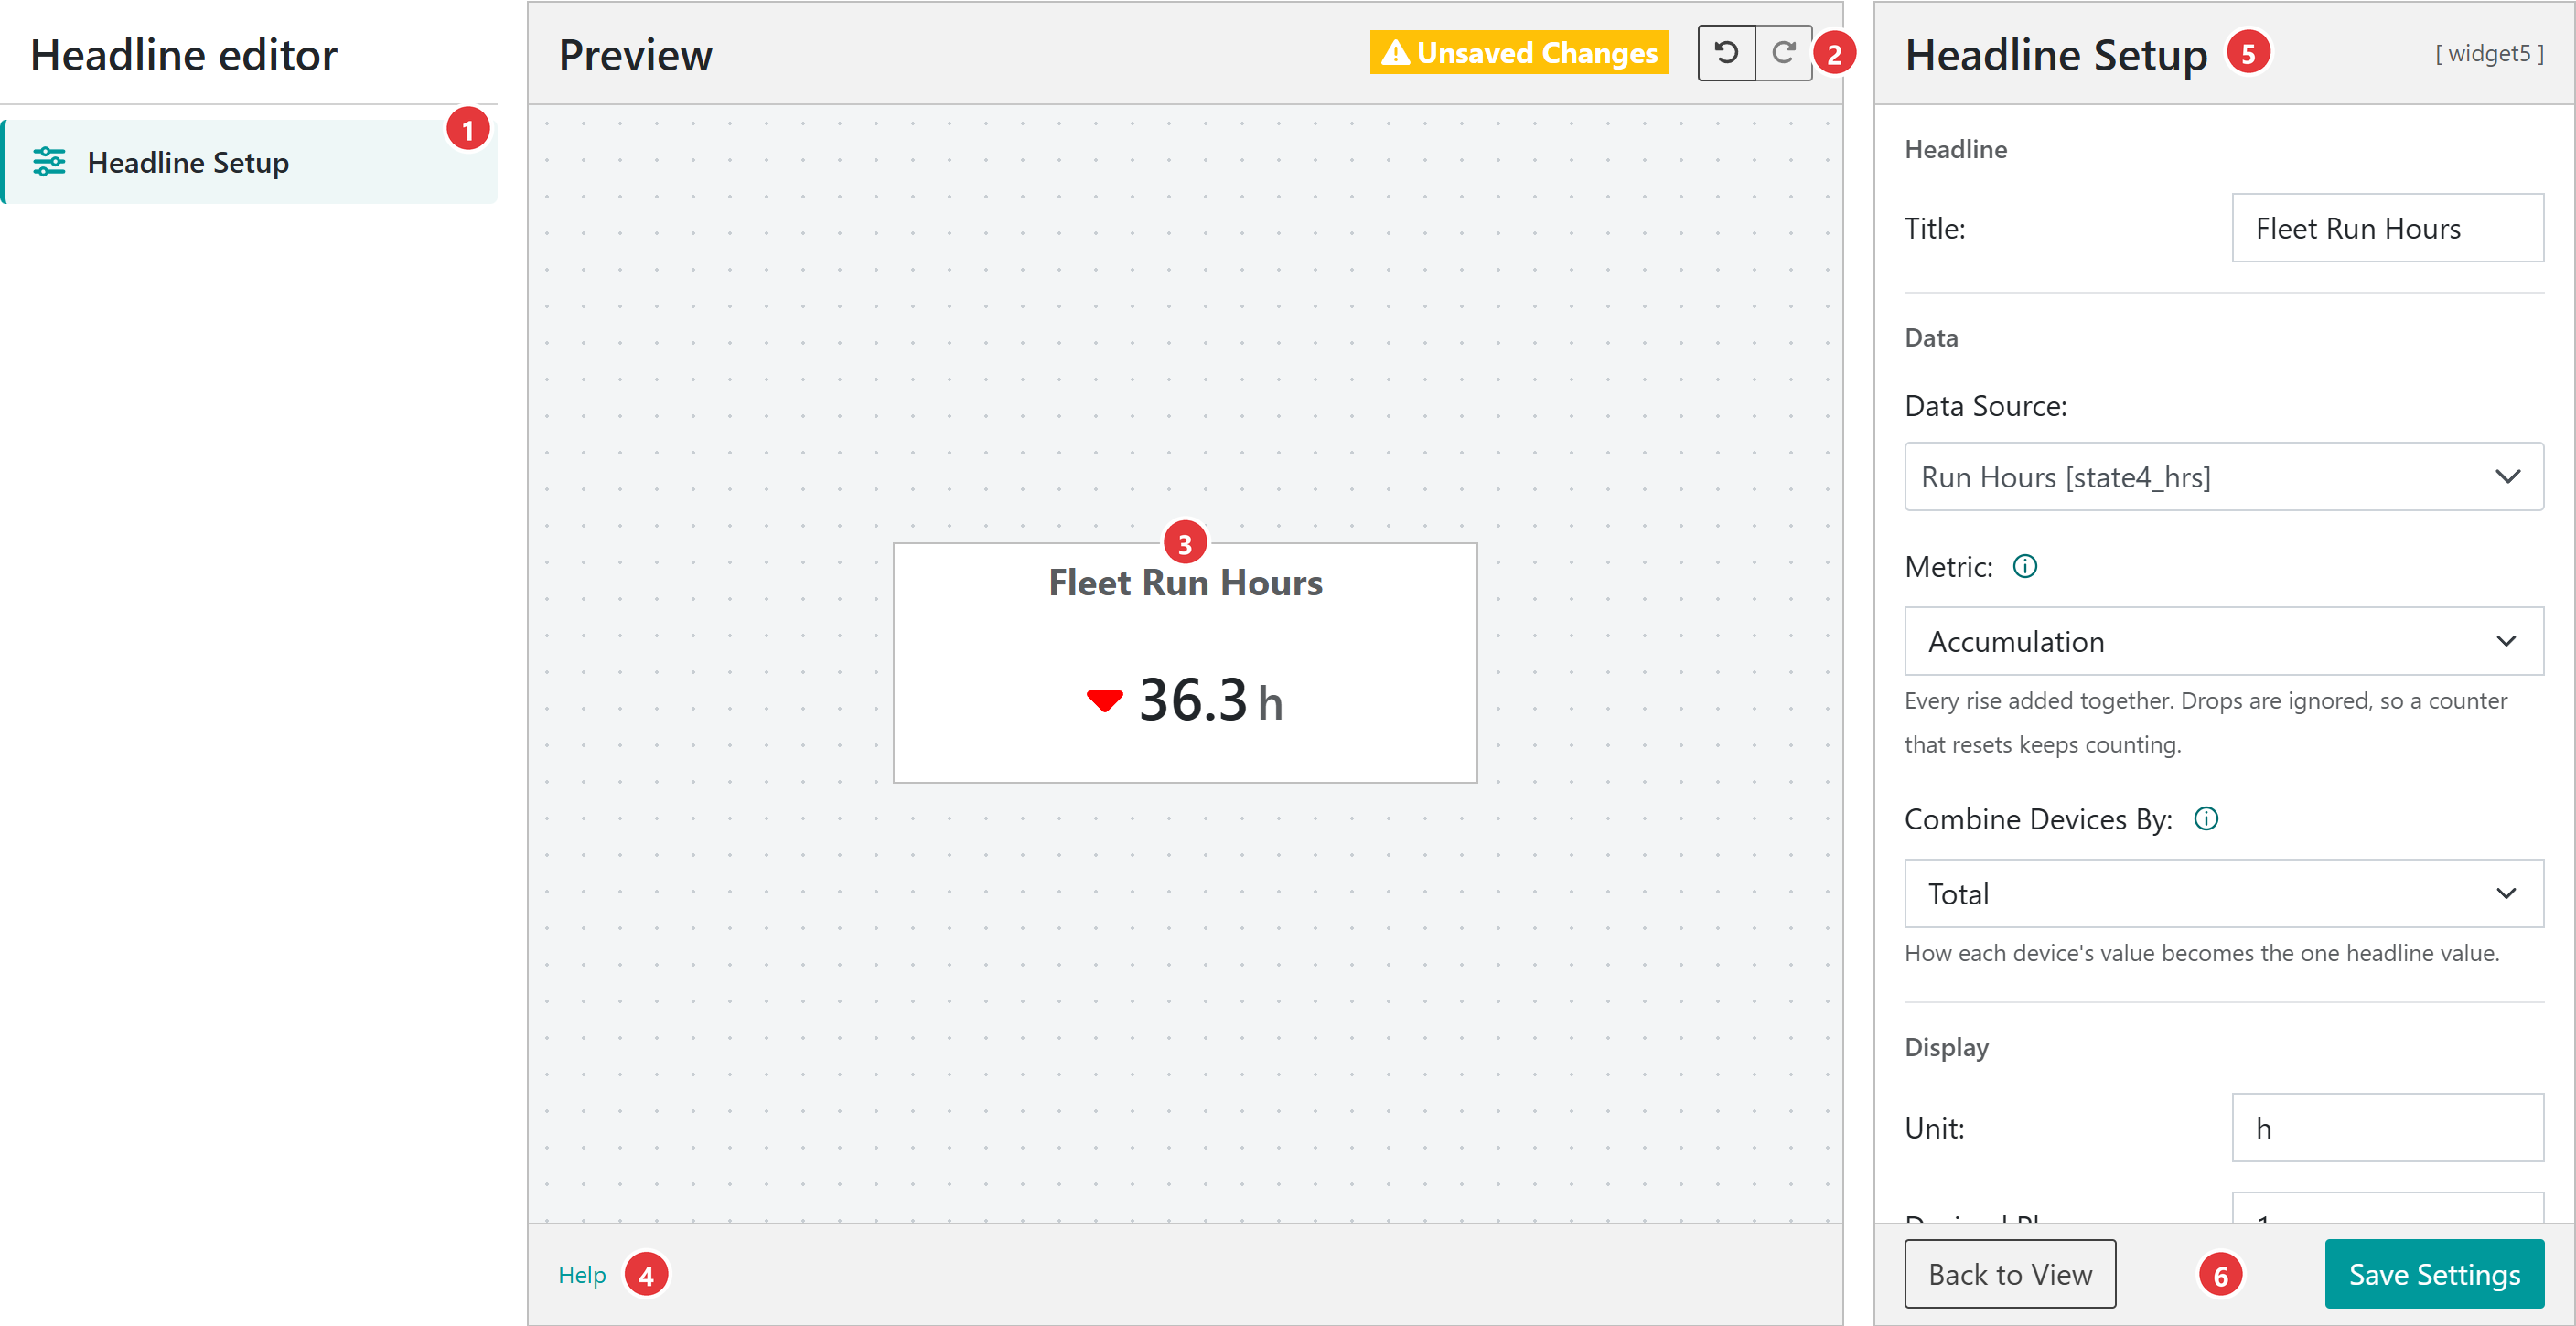
Headline numbers, charts and the summary table are each set up in an editor with the same layout: the widget’s parts on the left, a live preview in the middle, and the settings for whatever is selected on the right. The headline editor is shown below.
The left column lists the widget’s parts. Select one to edit it in the settings panel.
The preview toolbar shows Unsaved Changes when there is something to save, and the Undo and Redo buttons.
The preview shows the widget drawn with your group’s data. The preview uses every device in the group; on the view, filters on the summary table also apply.
The bar under the preview has a Help link to this guide.
The settings panel shows the settings for the selected part. The widget’s key, such as [widget3], is shown in its top right corner.
Save Settings stores the widget in the view. Back to View returns to the dashboard, and asks before discarding unsaved changes.
Save Settings keeps the editor open, so you can carry on editing. A new widget is only added to the view when it is saved. Undo and Redo step through up to 100 changes; on the keyboard, use Ctrl + Z and Ctrl + Y (⌘ on a Mac).
Warning
Only Back to View checks for unsaved changes. Leaving the editor any other way, such as with the browser’s back button or the breadcrumb, discards them.
To edit an existing headline or chart, select Edit Widgets in the view menu, then the eye icon on the widget. To delete a saved headline or chart, open it and select the bin icon beside Back to View. A view can hold up to 20 widgets, including its table and map.
The summary table widget is the primary element on a view. It shows metrics over the period for all devices in a view. In the example below, we see that fuel is low on some machines, indicated by the cells being marked red. On 2 machines, the fuel is very low, and alert messages are active. Idle hours when compared with the previous period are down on three machines as marked by the green down arrows. Run hours on 3 machines are up, a good outcome.
Select a device in the table to open its device data page. Columns can be sorted and resized. Typing in the boxes under the column headings filters the table temporarily; this also filters the headlines, charts and map until the page is reloaded.
Device summary table showing alarms on the fuel level
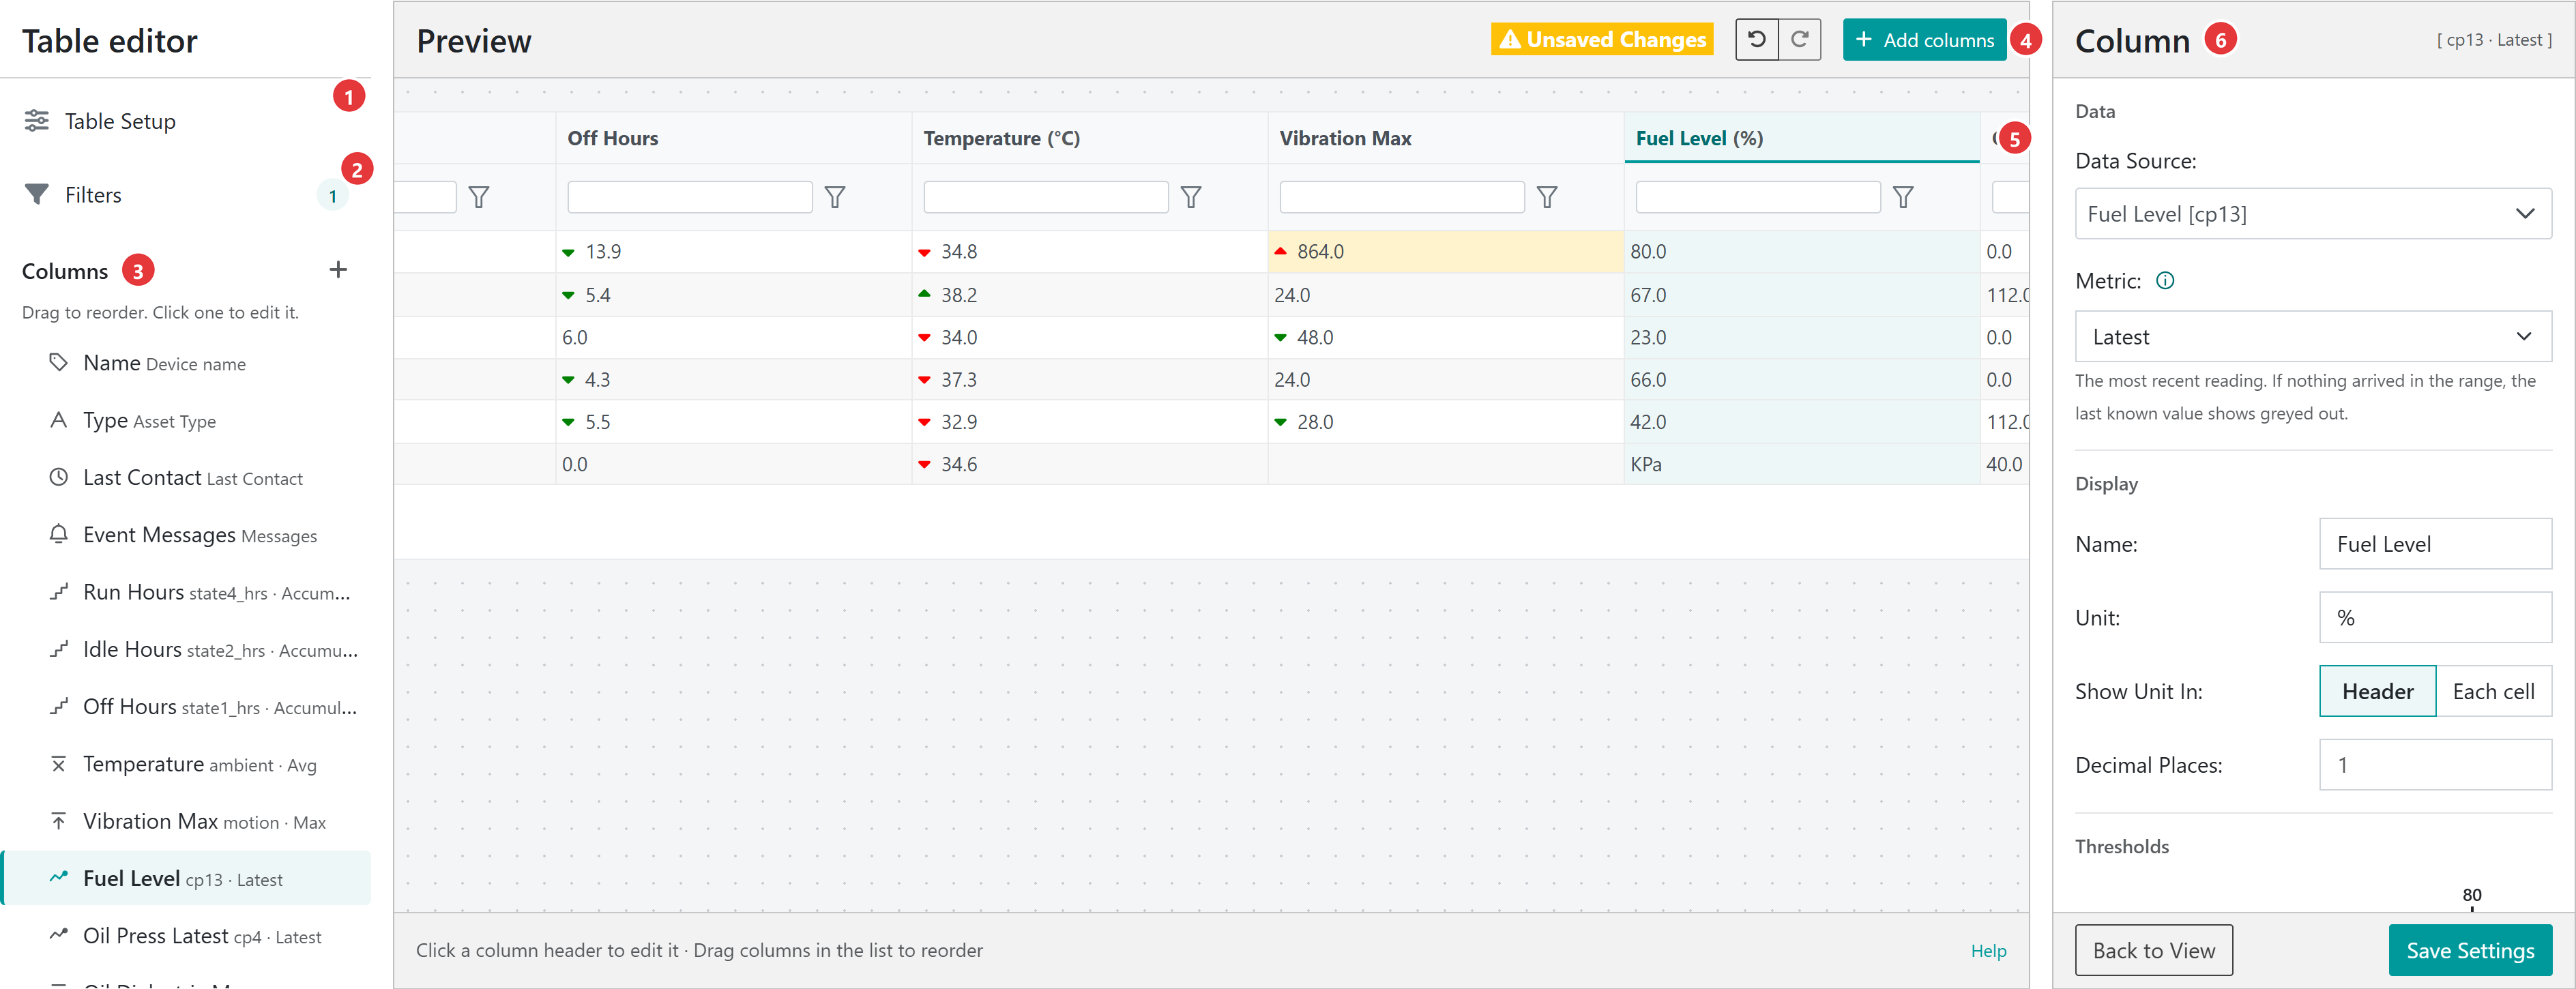
Select Edit Table in the view menu to open the table editor.
Table Setup sets the number of Rows Per Page: 10, 25 or 50. All devices that match the filters still contribute to the view, whichever page they are on.
Filters holds the view’s saved filters. The number shows how many are active.
Columns lists the table’s columns in order. Select a column to edit it, drag it to reorder the columns, or use + to add columns. The Name column is always first.
Add columns adds several columns at once.
Select a column heading in the preview to edit that column. The selected column is highlighted.
The settings panel shows the settings for the selected column.
Adding columns
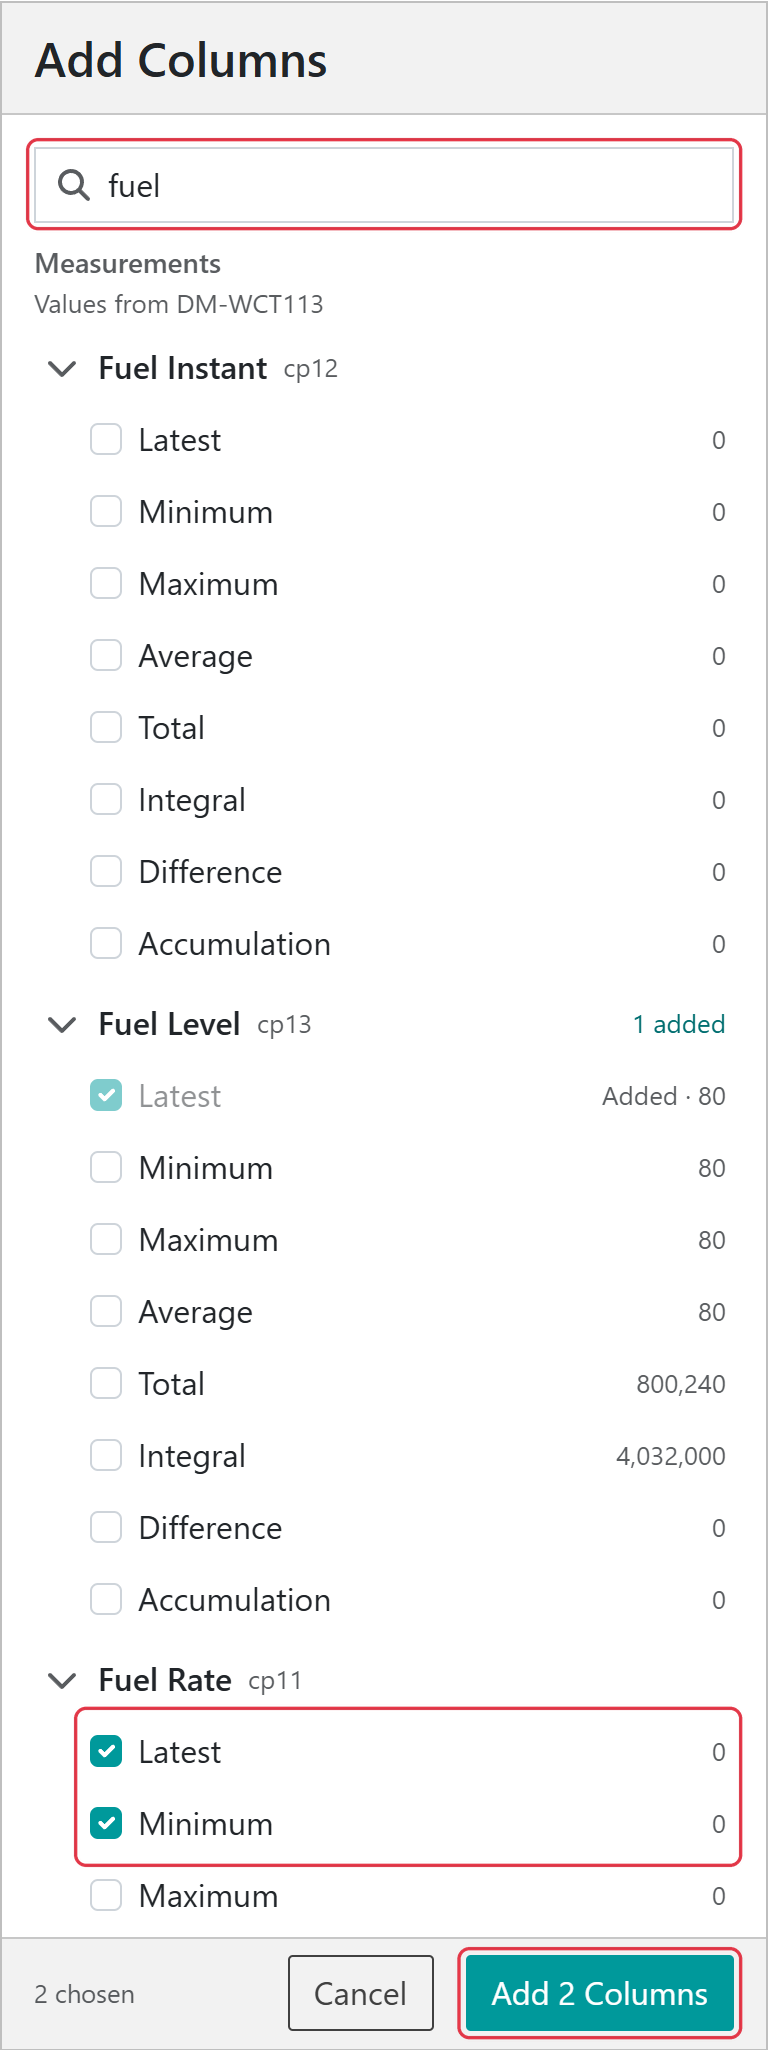
Select Add columns above the preview. Search for a measurement by name or key, expand it, and tick the metrics you want; each metric shows an example value from one of your devices. Device info columns (Device ID, Asset Type, Firmware, Machine Make, Machine Model and Last Contact) and Events columns (event messages, and counts of alarms, warnings, alerts and information events) are listed below the measurements. Columns already in the table are marked Added. Select Add Columns to add everything you ticked.
Search, tick the metrics you want, then select Add Columns
The measurement and how it is worked out. A metric already used by another column for the same measurement is not offered.
Name
The column heading. It must not be blank.
Unit
The unit shown with the values.
Show Unit In
Header, as Name (unit), or Each cell.
Decimal Places
The number of decimal places shown, 0 to 5.
Thresholds
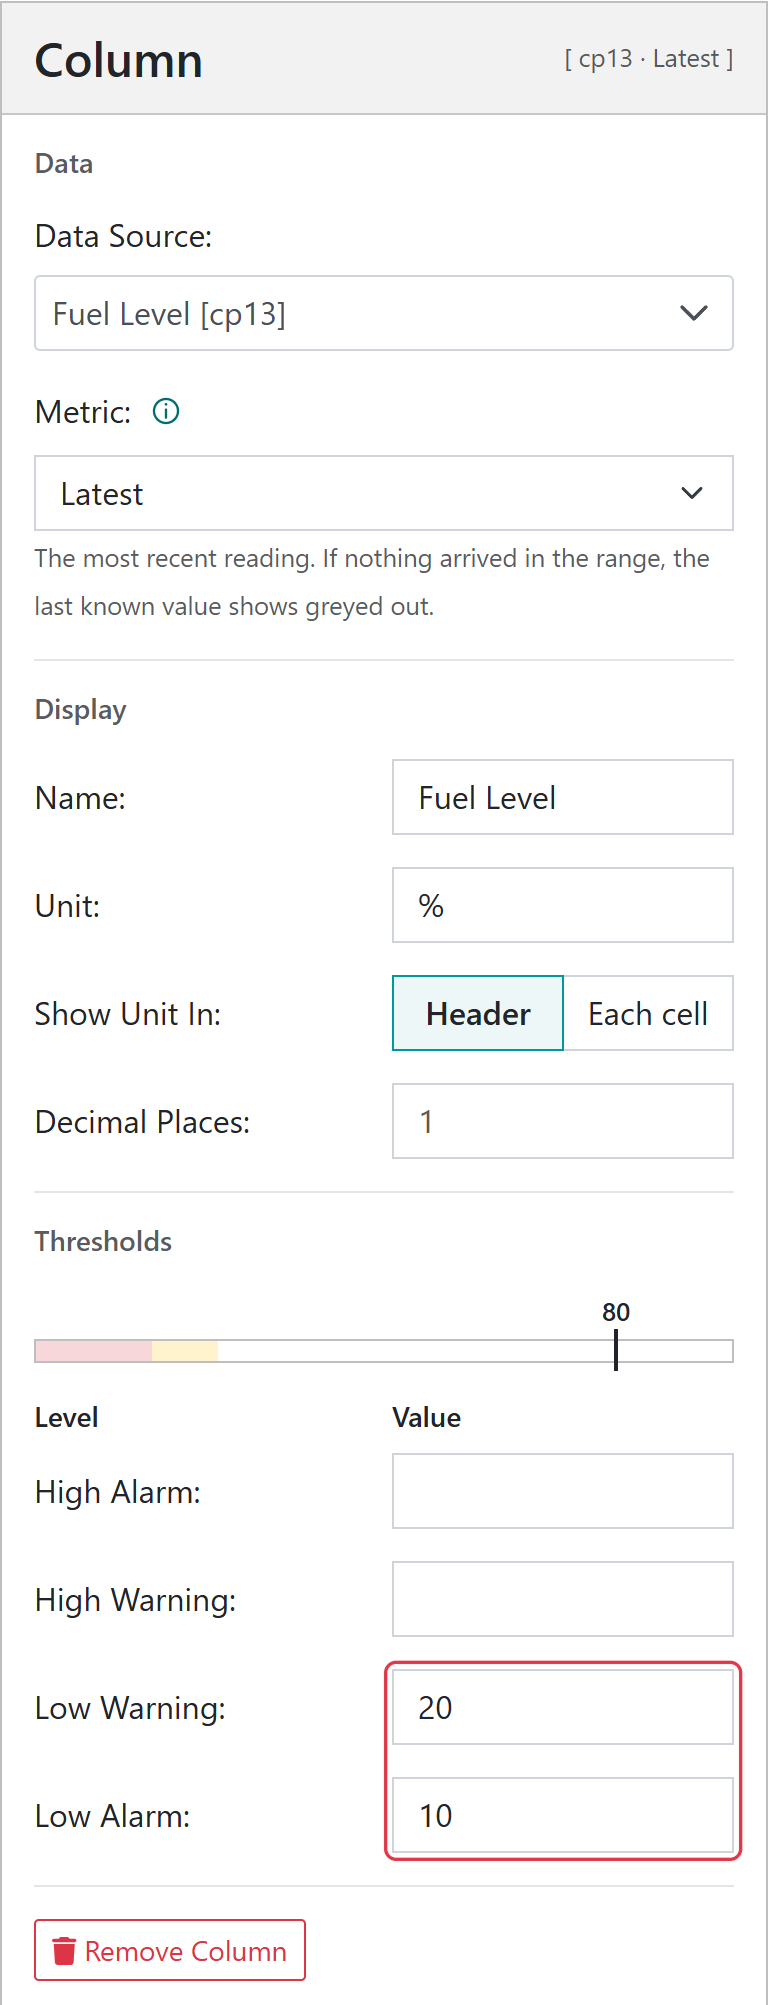
High Alarm, High Warning, Low Warning and Low Alarm levels. Cells at or beyond an alarm level are tinted red, and at or beyond a warning level amber. The bar above the levels previews the bands, with a marker at an example device’s value.
Trend arrow
Compares each device’s value with its value for the previous period. Choose None, up green and down red, up red and down green, or both grey. Arrows are on, up green and down red, unless changed. Not available for Latest.
Unit, decimal place, threshold and trend arrow settings are only shown for numeric columns. Use Remove Column to delete a column.
Filters
Filters single out devices from all the devices in the group. Filters set in the table editor are saved with the view and apply to its table, charts, headlines and map. For example, a group may be created that contains all the off-highway assets at a quarry. Different views can then be created to show lighting towers, pumps and crushers by adding a filter on asset type to the table of each view.
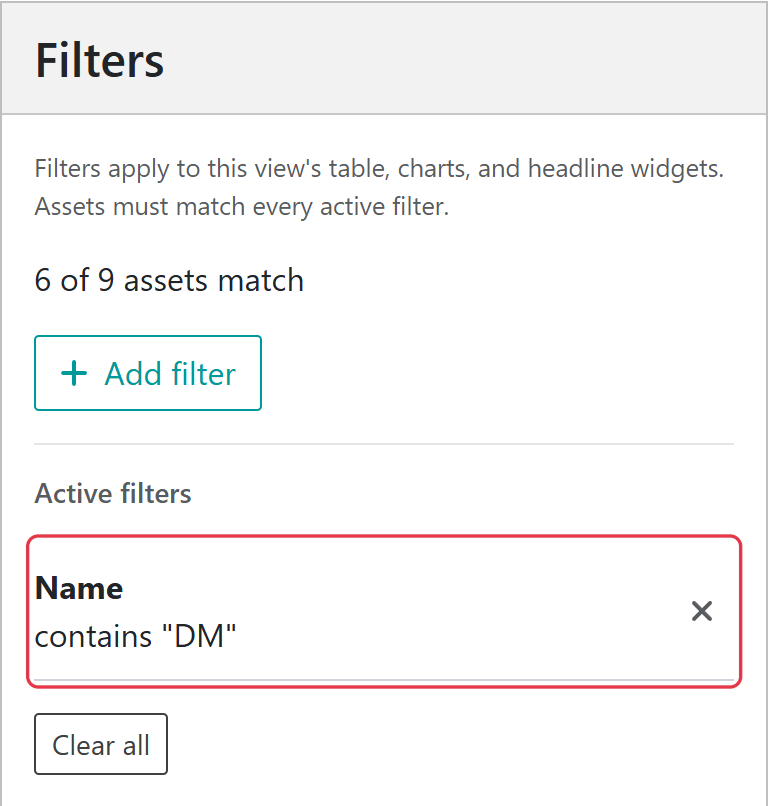
Select Filters in the left column, then Add filter. Choose a Column, a Condition and a Value, then select Apply filter. Text columns offer conditions such as Contains and Starts With; number columns offer conditions such as Greater Than and Between. Each column can have one filter, and a device must match every filter to be shown. The panel shows how many assets match.
A saved filter that keeps only devices whose name contains “DM”
Note
Export Table in the view menu downloads the table as a CSV file, with values unrounded.
Headline numbers combine one metric across all devices in the view. In the example below, total idle hours and total run hours across the devices in the table are shown as headline numbers. We can immediately see that idle hours are up over the last 7 days when compared to the previous period; the good news is that run hours are also up. Increased idle hours are bad and are marked with a red up arrow. Increased run hours are good and are marked with a green up arrow. Hover on the arrow to see the value for the previous period.
Headline numbers show metrics across all devices in the view
Select Add Headline in the view menu to open the headline editor. A headline is worked out in two steps: first the Metric is calculated for each device, then Combine Devices By turns the devices’ values into one number.
Metric works out each device’s value; Combine Devices By turns them into one
Setting
What it does
Title
The heading of the headline. A title is suggested from the other settings until you type your own.
Data Source
The measurement to use.
Metric
How the measurement is worked out for each device (see Metrics). All metrics, including Latest, are available.
Combine Devices By
Total, Average, Max or Min of the devices’ values.
Unit
The unit shown after the number.
Decimal Places
The number of decimal places shown, 0 to 5.
Trend arrow
Compares the headline with the previous period. Choose None, up green and down red, up red and down green, or both grey. Latest headlines do not show an arrow.
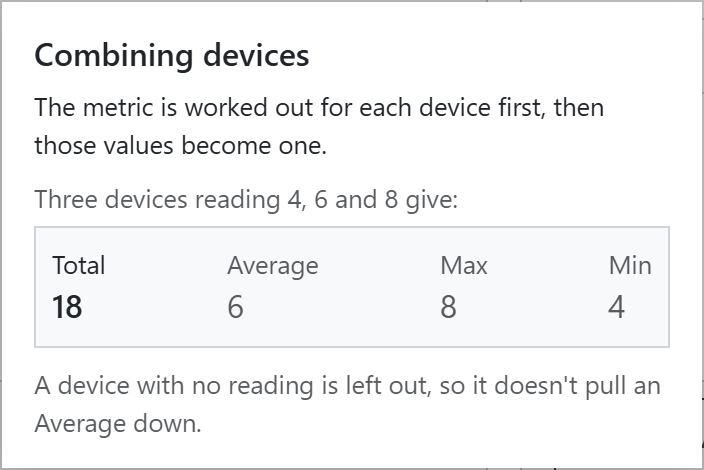
Combining devices: three devices reading 4, 6 and 8
Note
A device with no value for the metric is left out, so it does not pull an Average down.
Example - Fleet run hours
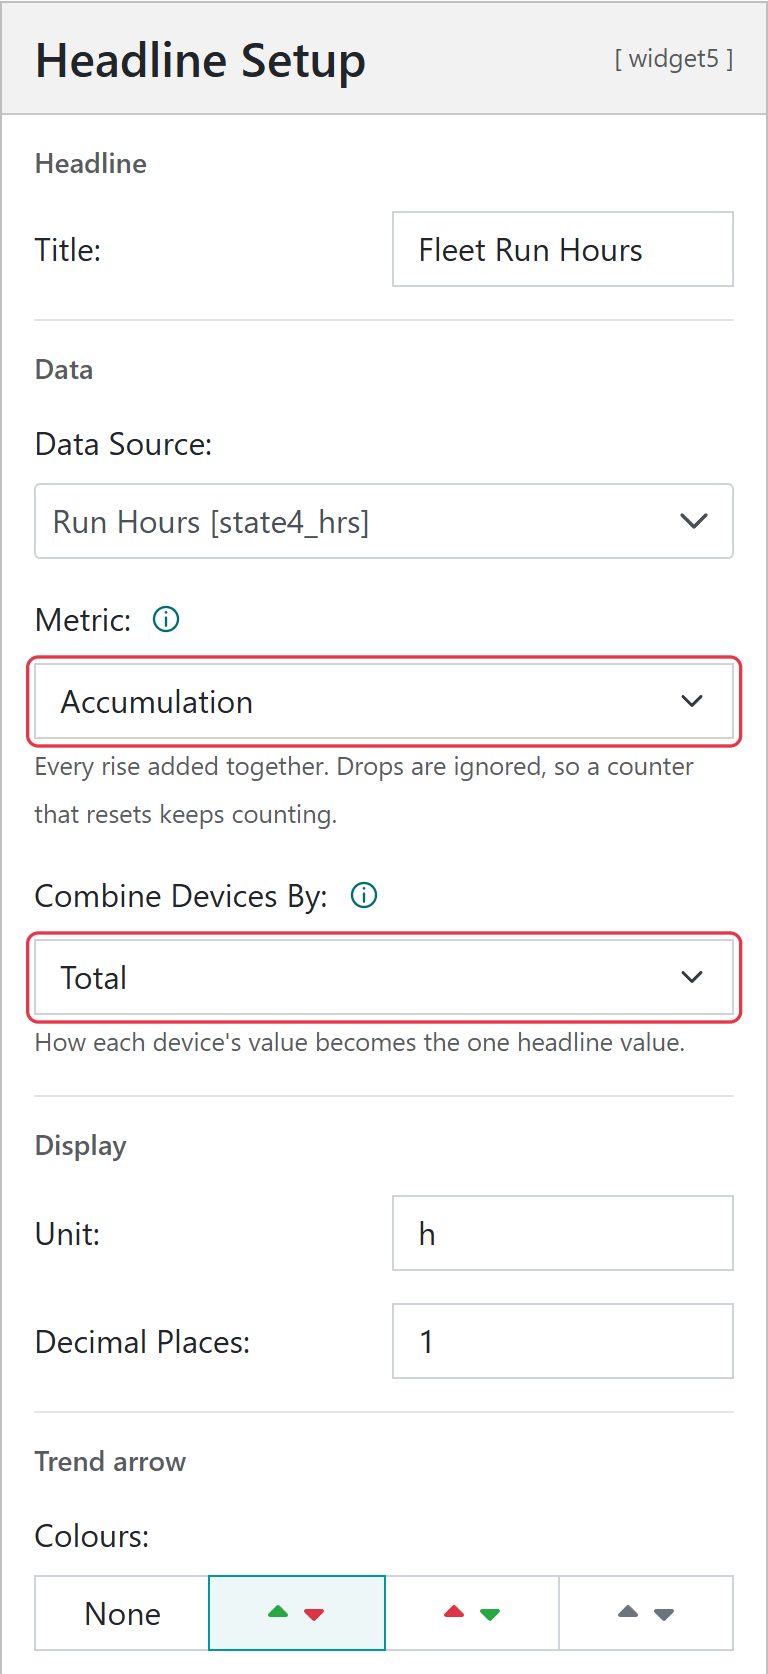
To show the total hours the fleet has run in the period, choose the Run Hours data source, the Accumulation metric so that a reset hour meter cannot cause a negative value, and combine devices by Total. Set the unit to h, and choose up green, down red for the trend arrow so that more running shows as good.
Charts show trend data across the period of interest, with one series for each device in the view. Line and area charts plot the metric for each hour of the period, or for longer intervals on long periods. In the example below, a stacked line chart is used to show total fuel used across all machines by the hour. It can be seen that the water cart used 12.09 litres of fuel for the hour ending at 07h00.
Select Add Chart in the view menu to open the chart editor.
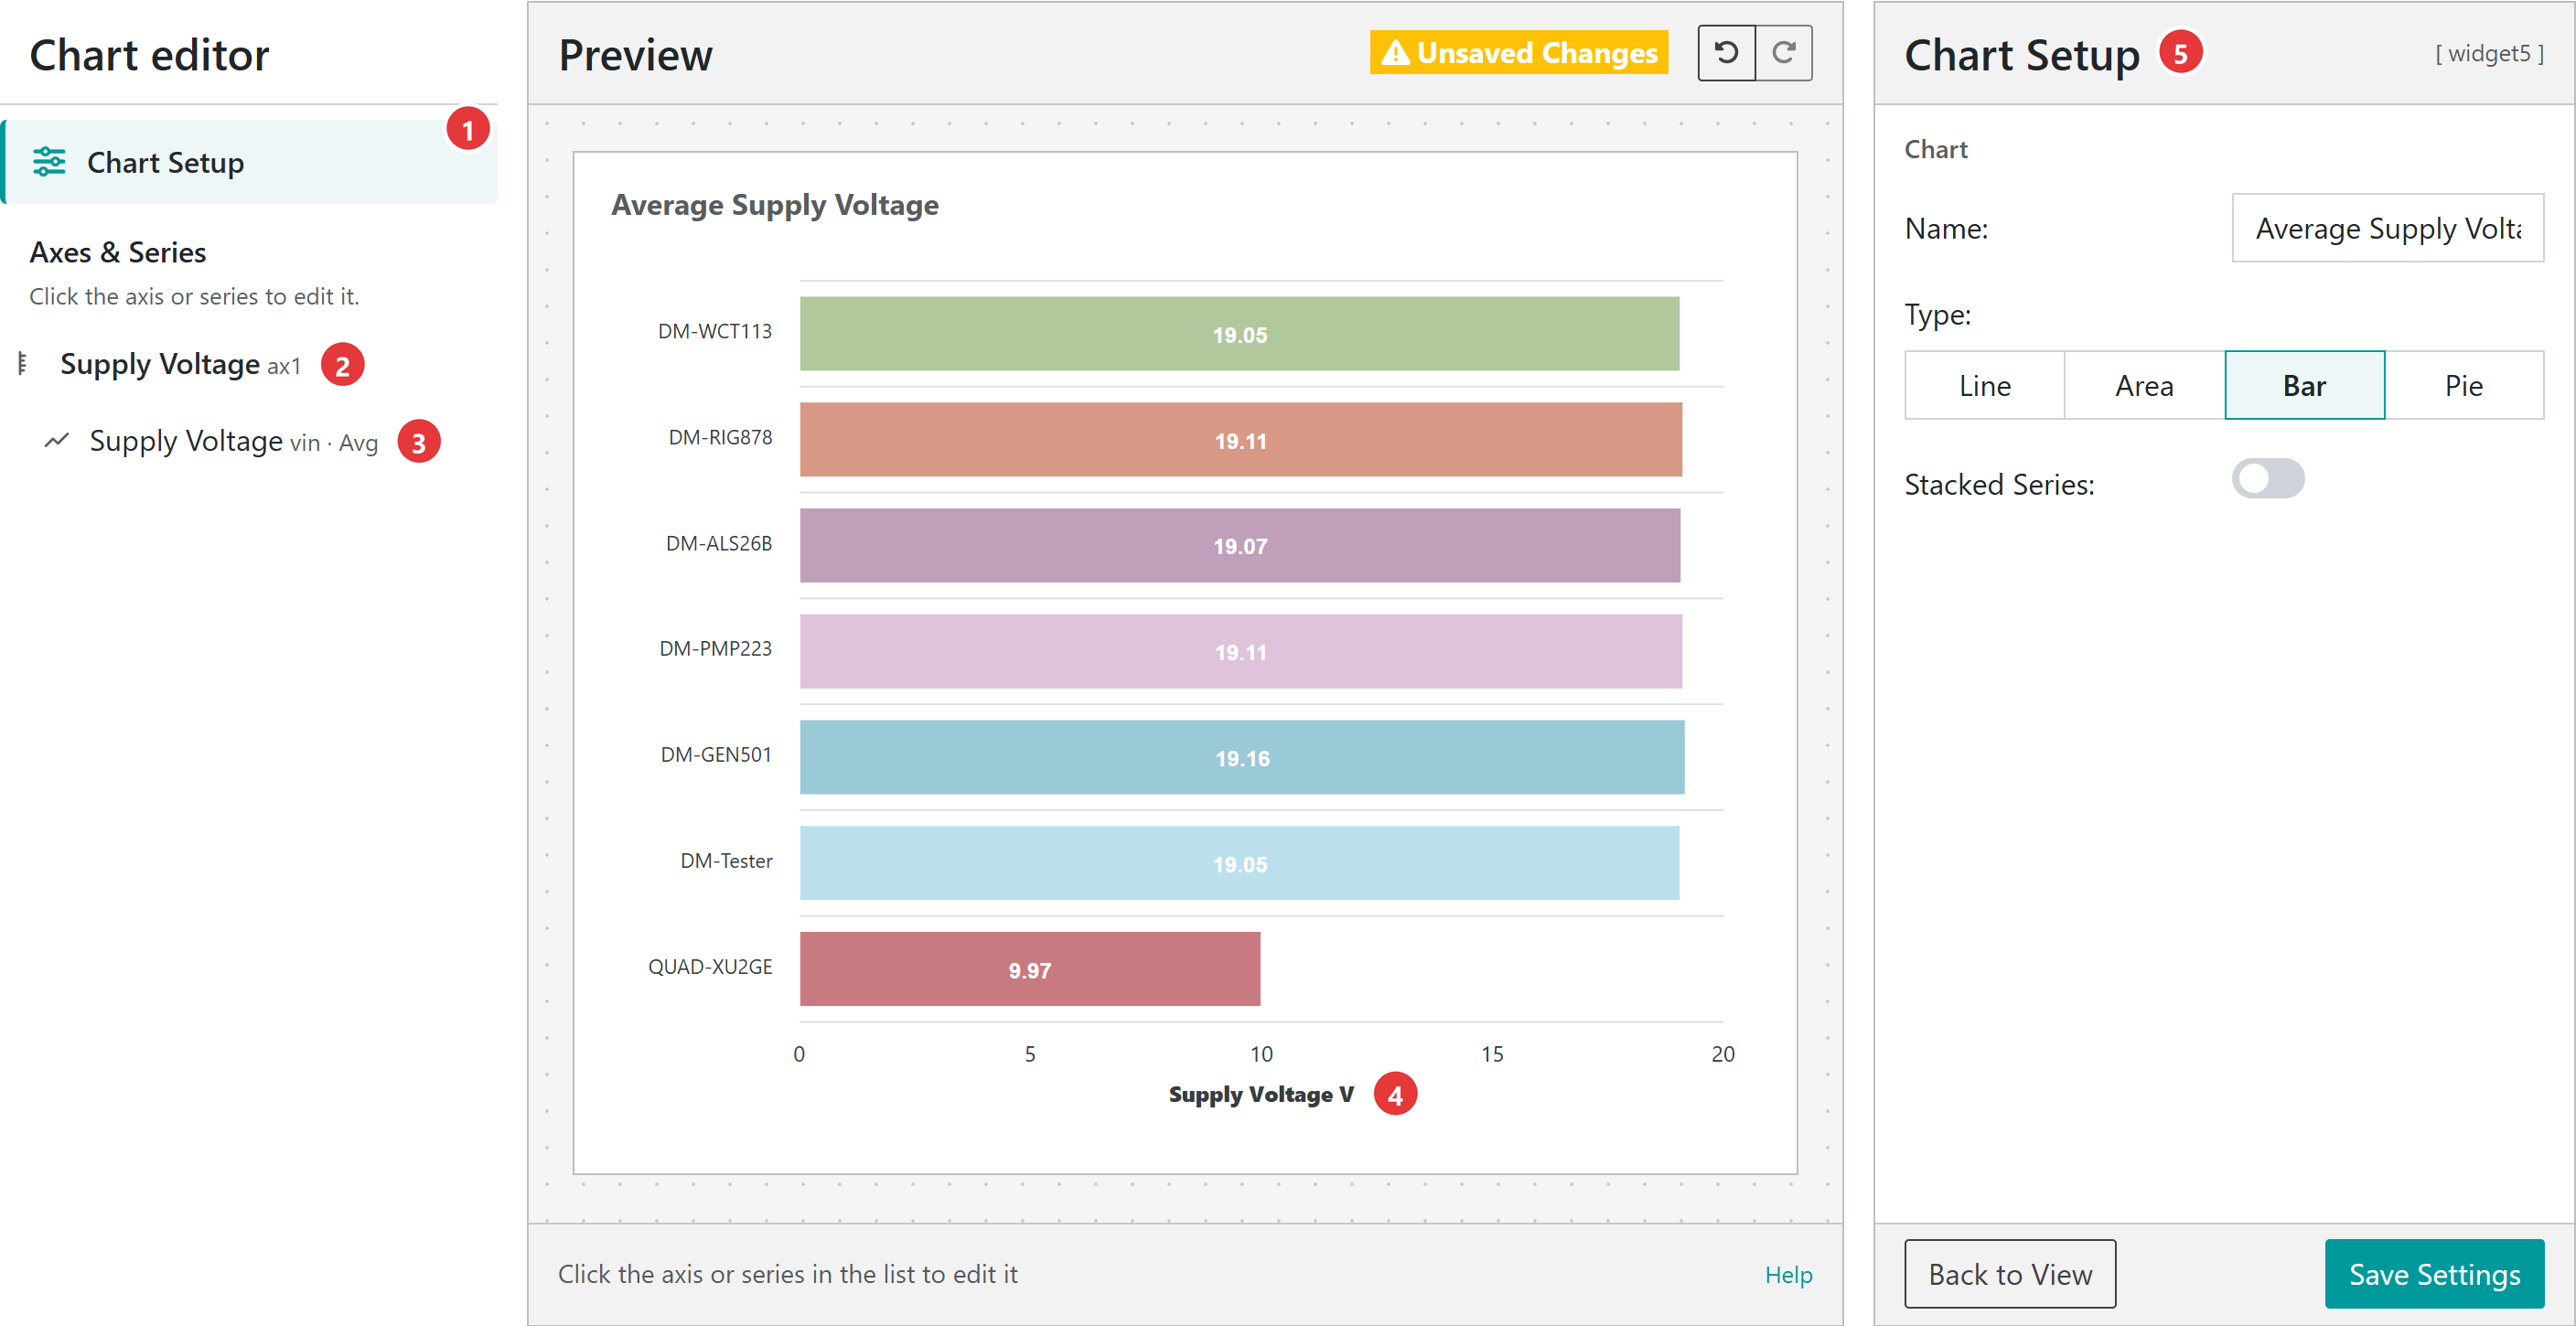
The group chart editor, showing average supply voltage as a bar chart
Chart Setup holds the chart’s name, type and stacking.
Y-Axis holds the axis name, unit, decimal places and scale.
Series holds the data source and metric. A group chart has one series, drawn once for each device.
Select the axis title on the preview to rename it.
The settings panel shows the settings for the selected part.
Setting
What it does
Name
The chart title. It must not be blank.
Type
Line and Area plot the metric over the period. Bar shows one bar for each device for the whole period. Pie shows each device’s share of the whole period; negative values are left out.
Stacked Series
Line, area and bar charts only. Stacks the devices so the top of the stack is the total. A stacked bar chart is a single column with a segment for each device.
Y-Axis
Name, Unit, Decimal Places, Range (minimum and maximum, or Auto) and Ticks. A bar chart that is not stacked is drawn on its side, so these settings apply to its horizontal axis.
Series
The Data Source and Metric to plot. Every device in the view plots this reading. Latest is not available for charts.
Line and area charts have a toolbar with zoom, pan, high and low markers, and a menu to download the chart as an SVG or PNG image or its data as a CSV file.
Note
A chart plots up to 15 devices. Use filters on the view’s table to choose which devices are shown.
A map is added to new views. It can be removed with the bin icon in Edit Widgets mode, and added again with Add Map in the view menu. A view can have one map.
Clusters of devices separate as the zoom level increases
Where there are many devices in the same area, they cluster and are shown as the number of devices in that area. As the zoom level is increased, the devices separate. The map shows the devices that match the table’s filters and have a GPS position.
The colour of the labels on the map indicates whether there are any current events on the device:
Grey: no events
Teal: alerts
Amber: warnings
Red: alarms
Select a device on the map to see when it last reported, and select Device Page to open its device data page.
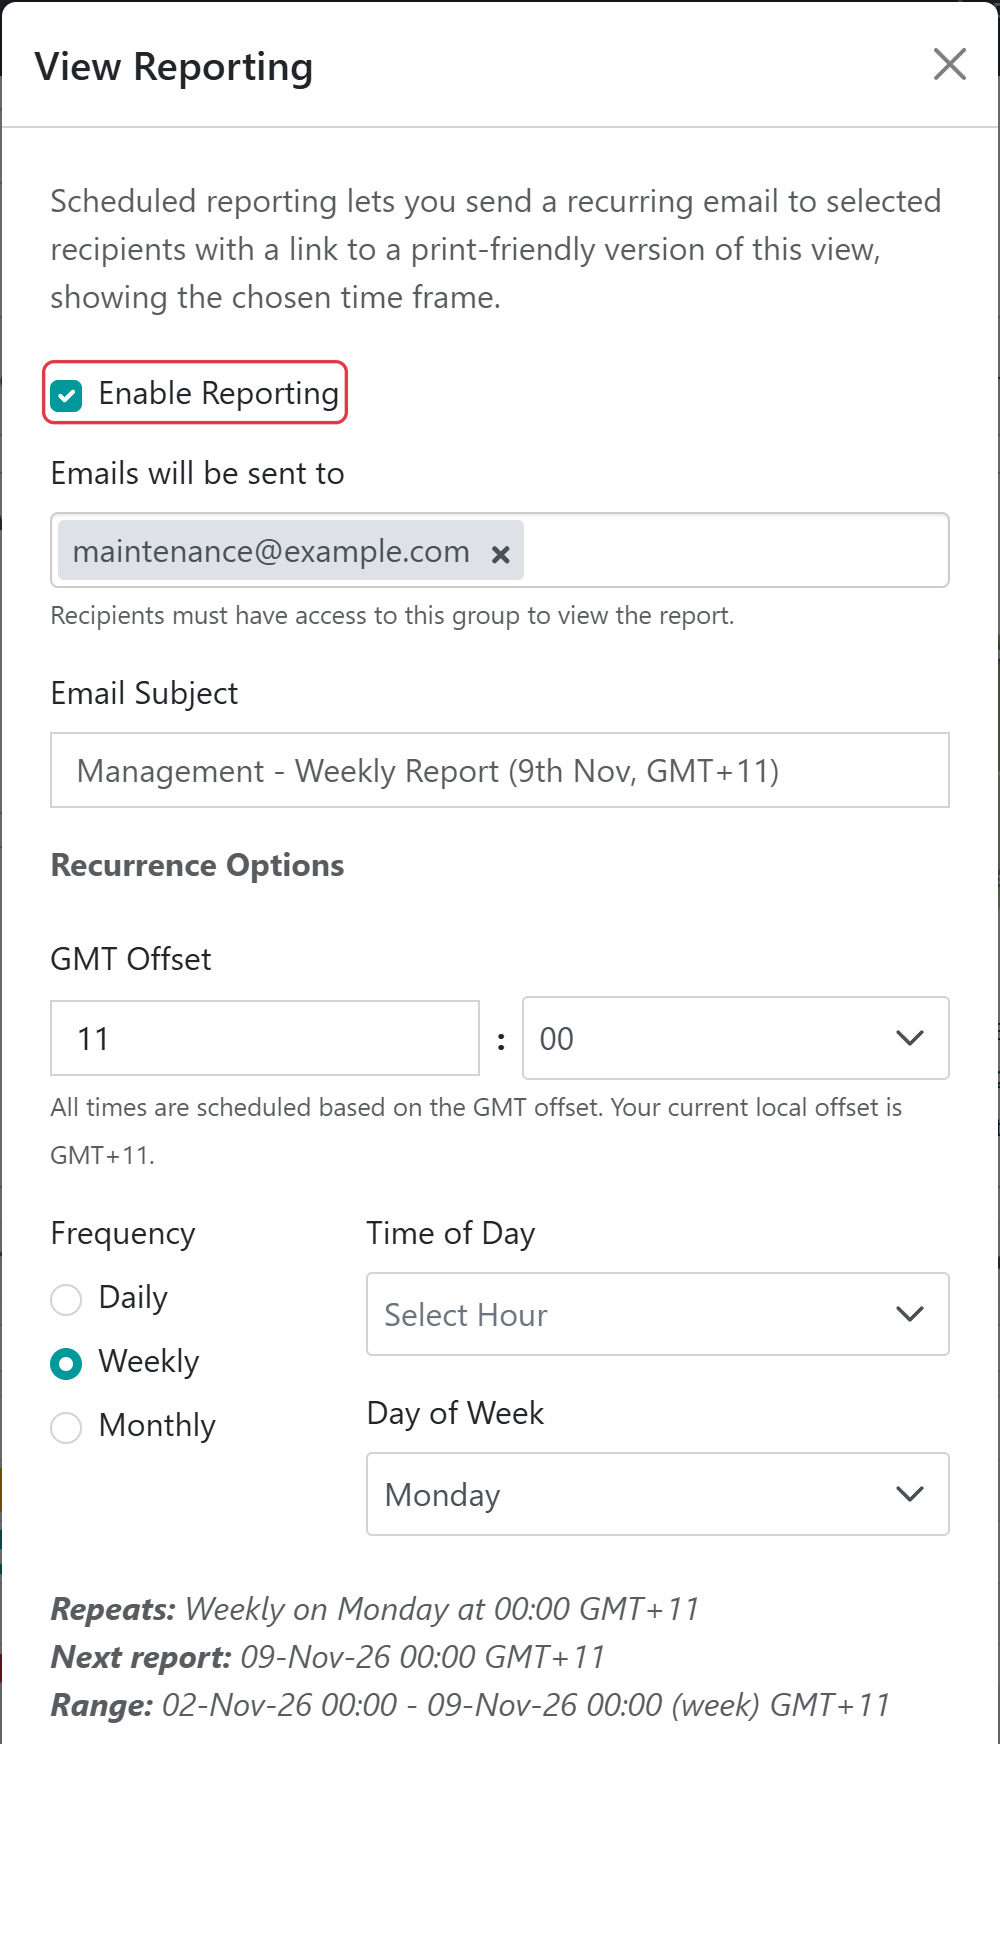
Select Reporting in the view menu to email a link to a printer friendly version of the view on a schedule. Tick Enable Reporting to show the schedule settings.
The recipients. Recipients must have access to the group to view the report.
Email Subject
The subject of the email.
GMT Offset
The time zone used for the schedule.
Frequency
Daily, Weekly or Monthly, with the Time of Day, Day of Week or Day of Month to send it.
The report covers the last day, week or month, according to the frequency, rather than the view’s period. A summary at the bottom of the window shows when the next report will be sent and the range it will cover.
To print a view yourself, select the printer icon beside Group Settings. The printer friendly view lets you choose the Orientation, Page Size, and whether to Show Map, and can download the table as a CSV file.
Build a view for each audience. A maintenance view might show engine hours and service due; a management view, utilisation and fuel used.
Pick the right metric for counters. Use Difference for an hour meter that never resets and Accumulation for one that might. Total adds up every report, so it is only right for amounts per report.
Read the metric card. The information icon beside Metric shows how the metric works with a real value from one of your devices, which is a quick way to check you have the right one.
Decide what a rise means. Choose the trend arrow colours so that green is good: up green for run hours, up red for idle hours.
Use filters to focus a view. Saved filters on the table also limit the headlines, charts and map, so a “Pumps” view can show pump totals only.
Remember the preview uses every device. The editors ignore the table’s filters, so a headline can read differently in the editor than on a filtered view.
Keep charts readable. A chart plots up to 15 devices; filter the view or use a bar chart for larger fleets.
Share a custom range by link. A custom range is kept in the page address, so copying the link shares exactly what you are looking at.
Save before you navigate. In the editors, only Back to View warns about unsaved changes.
No device in the view has a value for the metric in the period. Check the Data Source, try a longer period, or for Latest check that the devices’ latest messages include the value.
A headline reads differently in the editor and on the view
The editor’s preview uses every device in the group; the view only uses devices that match the table’s filters.
A Total is far larger than expected
Total adds every reading, so it grows with how often devices report. For a counter use Difference or Accumulation; for a rate use Integral.
A Difference is negative
The counter was reset during the period. Use Accumulation.
The period selector is missing
No widget on the view uses a metric over the period; every column and headline uses Latest.
A device is missing from a chart
A chart plots up to 15 devices, and only devices that match the table’s filters and have a value for the metric.
A measurement only offers Latest, or cannot be charted
Some measurements, such as states and GPS positions, only support Latest, and charts do not offer Latest.
The Device Data Page offers a centralised and intuitive view of all real-time and historical measurements reported by a Senquip device. Data is shown in real time and can be visualised as numbers, gauges, charts, or infographics.
The following are key elements of the Device Data Page:
Device Data Pages provide a detailed view of measured data
Key
Element
Description
1
Device Name
The name associated with the Senquip device
2
Toolbar Icons
Provide quick access to device settings, scripting, raw data, and more
3
Asset Image
Optional application image
4
Map
Shows the current device location and historic track
5
Trigger Buttons
Allow for remove control by activating functions locally on a remote device
6
Events
Shows all active alerts, warnings, and alarms for a device
7
Infographic
User generated graphical widget that allows information to be shown in a meaningful way
8
Number
Widget displaying numerical data as a number
9
Utilisation
Pie chart showing asset utilisation
10
Gauge
Numerical data shown as a gauge
11
Chart
User generated chart showing trend data
12
Device Info
Shows information about the device
13
Raw Data
(Not shown) The raw JSON data for a device
The Device Data Page is also the central hub for managing device setup. From the toolbar icons on the page, you can select the following:
Asset Notes: Add notes and images associated with the device application and install.
Display Settings: Choose which measurements are displayed, and the order in which they are displayed. Create custom Graphical Widgets and Charts.
Scripting: Link to the device scripting page to customise device operation, create custom parameters, add trigger buttons, and configure states.
Diagnostics: View device diagnostics information, SIM information, signal strength and more.
Server Log: Show a log of all user activity including when settings were changed, and when users were added.
Settings: Change device settings, perform firmware upgrades, and configure events.
Raw Data: Download historical data and export to CSV if required.
Note
Available options will vary depending on user permissions.
As measurements are enabled on the Senquip device, associated widgets will automatically appear on the Device Data Page. The widgets can be turned on and off, and the order of display can be changed.
Page Layout
Select the Display Settings icon to choose which measurements are displayed, and the order in which they are presented.
Turn widgets on and off and configure the display order
Add Asset Image and Logo
Select the Asset Notes icon to upload an image of the asset being monitored, a brand logo, the install location, and to make notes about the install.
Change Widget Display Format
Press the eye icon at the bottom right of the widget to switch between various display formats. Available formats are:
Hidden - Hide the data if it is not relevant to the application
Trendline - The default graph that facilitates recognition of change. Allows the user to view longer term trends between date ranges.
Gauge - Useful when representing measurements that must exist within a range. Can be scaled so that the pointer is vertical under normal conditions. Warning and alarm levels can be set.
Digital - A simple ON or OFF display that shows the status of a measurement. The threshold at which the display switches from ON to OFF can be set.
Switch between numberic, gauge, and digital display modes
Click on the icon at the top right of each widget to show numerical data on a chart over a selected period. Click on a point on the chart to show values at that point.
To view or download historical data, press the Raw Data button on the top right of the dashboard. A table showing all the data associated with the selected device will be shown. To download the data, press the Export to CSV button. The data will be saved to your downloads folder. The downloaded file can be opened and manipulated with any spreadsheet tool.
Data associated with the selected device shown in a table
Note
The timestamp in the timestamp column is in Unix Time; if you would like a GMT date and time field, enable the timestamp setting in endpoint settings.
In addition to group-level user permissions, permissions can also be managed at the individual device level. This is particularly useful when a user needs access to configure or manage a specific device without being granted administrator rights across the entire group.
To adjust device specific permissions, navigate to the device data page and click the User button. From there, you can assign or modify access for individual users as required.
Warning
Anyone who has the device ID and setup password can add the device to their account with Admin permissions.
Settings associated with a Senquip device can be updated remotely via the Senquip Portal. To change the settings for a selected device, press the Settings button on the top right of the dashboard. The selected device settings will be shown and can be changed by clicking in the relevant fields. Once a setting has been changed, press the Save Settings button at the bottom of the page.
Senquip devices check for settings changes each time they make a connection to the Senquip Portal. If a device is set to transmit data once an hour, then the settings will be changed up to an hour after the changes have been made on the portal. If quicker changes are required, the device will need to be visited and the changes made via the integrated webserver in setup mode.
Remote update of device settings via the Senquip Portal
Note
In applications where power is available, a quicker transmit interval will mean that settings changes can be made more quickly.
Senquip will routinely make firmware updates to enable new features, enhance security and fix bugs.
Device firmware can be updated via the Senquip Portal. To update the firmware, press the Update button on the settings page. You will be directed to a page asking for the firmware number. This number can be found in the Device Firmware Changelist on the Senquip website or through your preferred distributor.
A Firmware Update typically takes about 5 minutes on Wi-Fi and 20 minutes on 4G LTE. During the update the green light will be off and the orange light will flash fast. Once the device has received the firmware update and is processing it, the lights may appear to freeze. This is normal behaviour. Please allow plenty of time for the device to finish the update and return to normal operation.
Note
There is always a risk that something may go wrong during a firmware update; it is not recommended that firmware be updated unless it is suggested by Senquip or a specific new feature is required.
The Senquip Portal allows forwarding of alert, warning, and alarm events generated on a device to email or SMS endpoints. A Hosted plan is required for this feature. Use the Events page on the Senquip Portal to configure event reporting. Events can be configured to be sent once as they occur, or with a daily reminder.
Warning
Make sure to add no-reply@senquip.com to your safe senders list on you email client to prevent email events from going into spam or junk folders.
If an event is current, and the event escalates, for example a warning turns into an alarm, the more severe event will be forwarded. If an event is current and it de-escalates, for an example, an alarm turns into a warning, the event will not be forwarded. If a type of event is current, and a new type of event occurs, the new event will be forwarded. For instance, if a high current warning is active and has been forwarded to email or SMS, and a high temperature warning becomes active, the high temperature warning will also be forwarded.
When a device reconnects and sends buffered data, the following rules apply:
If newer data has already been received, older buffered data is processed but no alerts are sent.
If no newer data exists, alerts are only sent for buffered data that is less than 12 hours old.
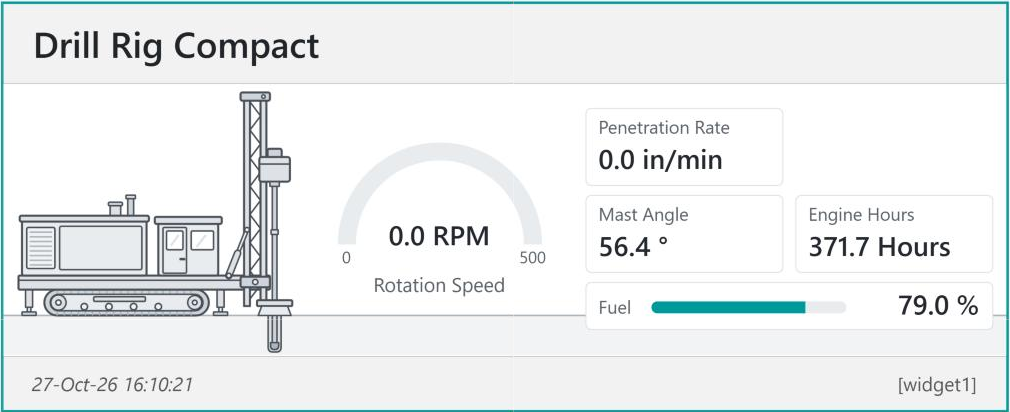
Custom widgets can be added from the device data page using the Display Settings icon and selecting Add Custom Widget. They show a device’s data the way that makes sense for the machine it is fitted to: a drawing of the machine with its readings beside the parts they measure, gauges and level bars that change colour at your thresholds, and status lights for alarms. Custom widgets sit on the device data page alongside the standard widgets, and are built in the Widget Editor.
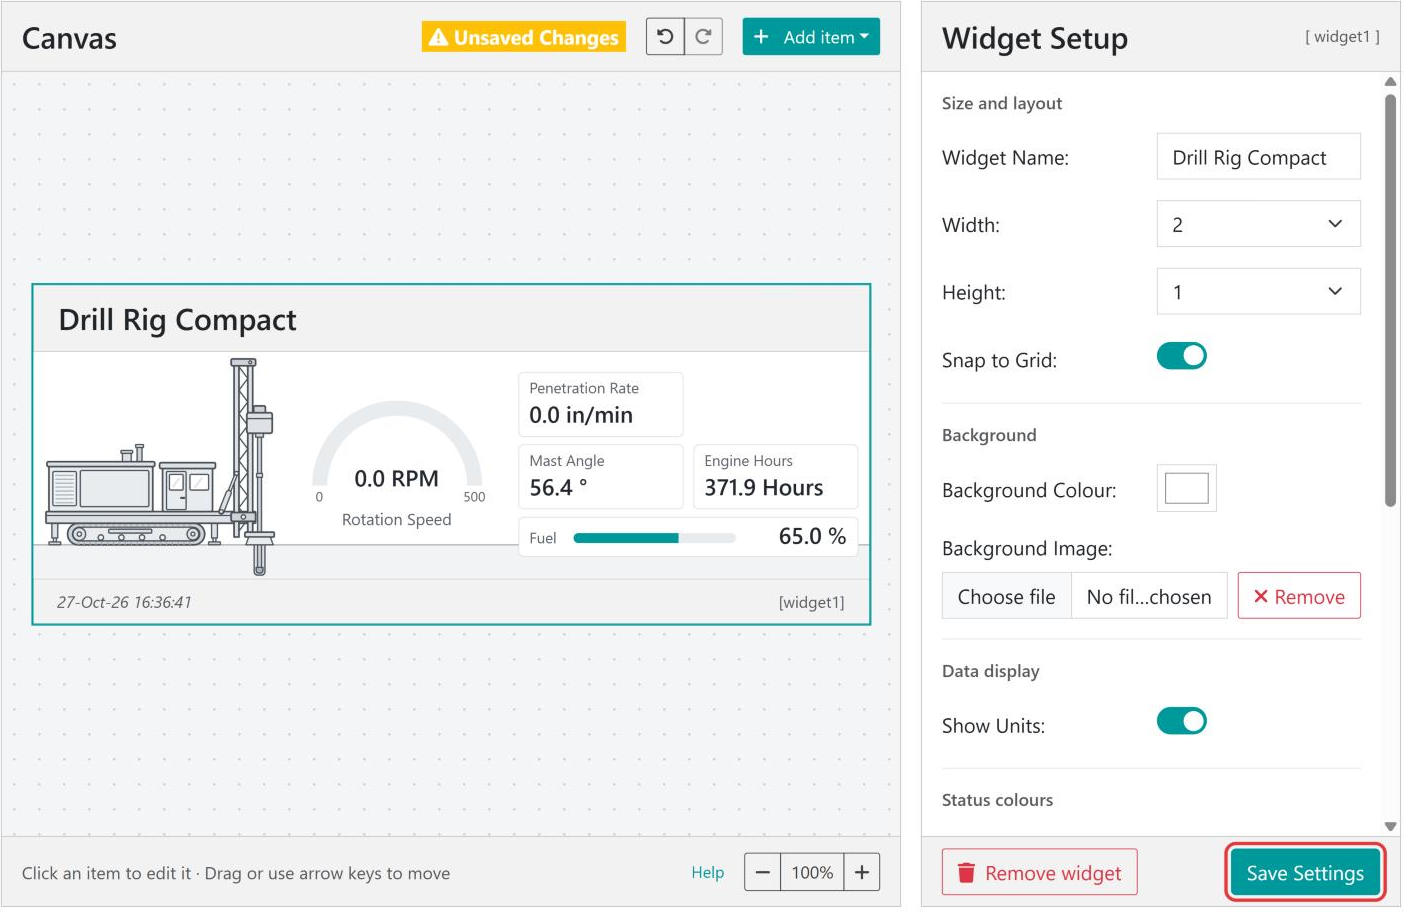
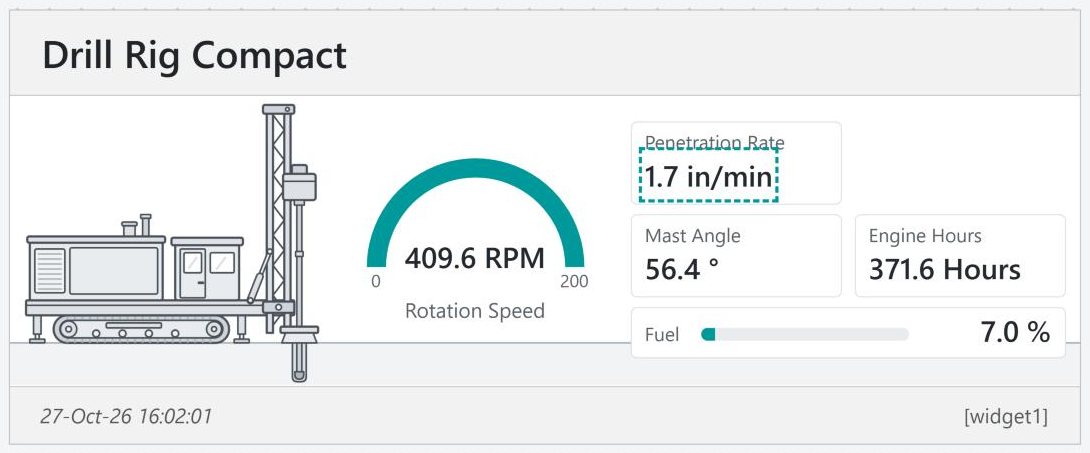
A custom widget made from the Drill Rig Compact template
This guide walks through building a widget for a drill rig, then describes every part of the editor, and finishes with tips and troubleshooting.
Widgets belong to a device, so the editor is opened from the device’s data page.
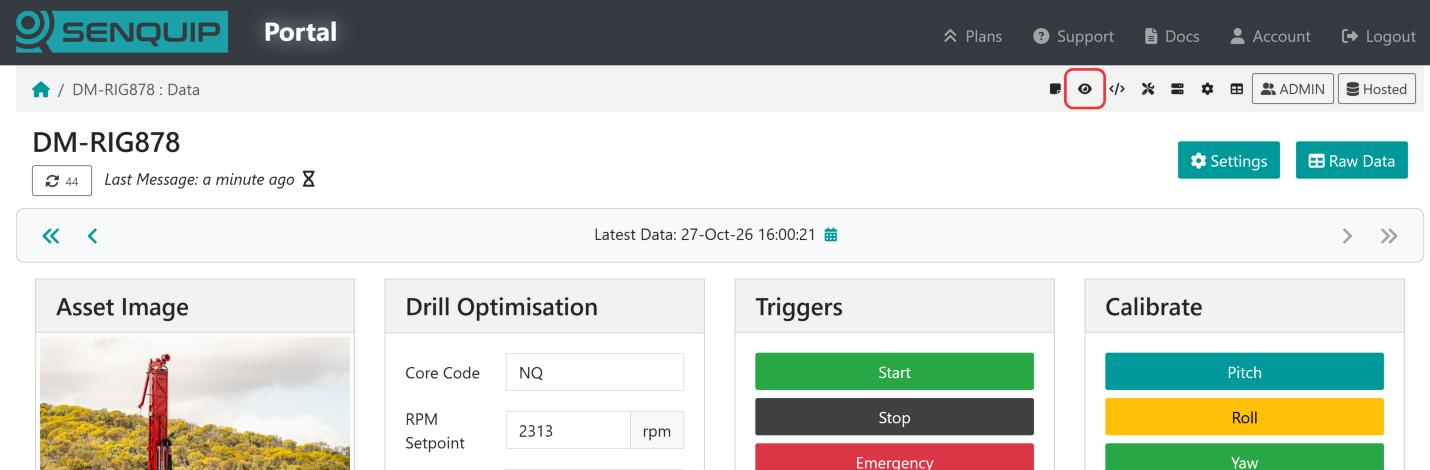
Open the device data page and select the Display Settings icon (the eye) in the bar at the top of the page.
The Display Settings icon on the device data page
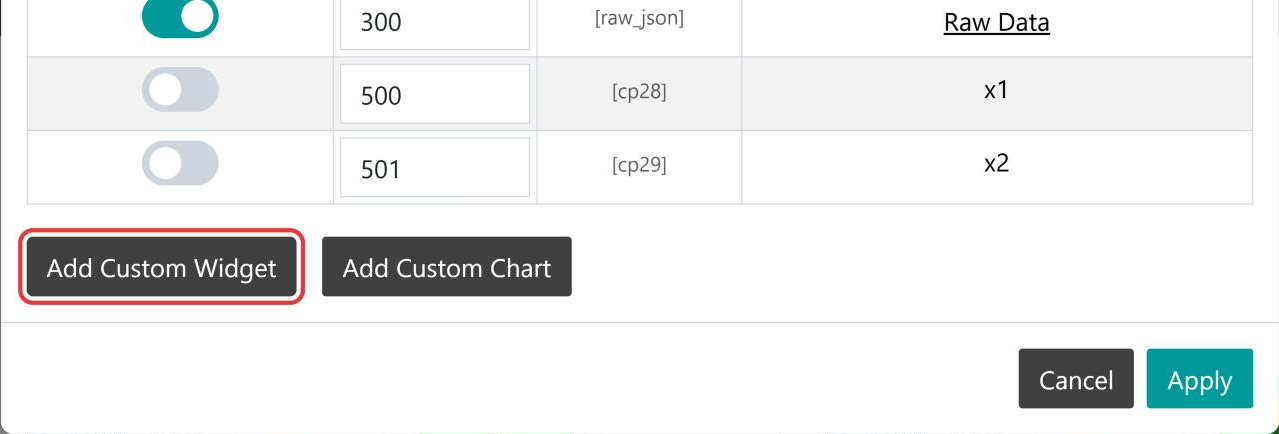
Scroll to the bottom of the Display Settings window and select Add Custom Widget. A new widget is created and the Widget Editor opens.
Add Custom Widget at the bottom of Display Settings
To edit a widget you have already saved, either select its name in the Name column of Display Settings, or select the eye icon beside the widget’s key (for example [widget1]) in the bottom right corner of the widget on the device data page.
Note
The Display Settings icon, and the edit icon on each widget, are only shown to users who are allowed to change the device’s display settings.
Note
A new widget is not stored on the device until you select Save Settings. If you leave the editor before saving, nothing is added to the device.
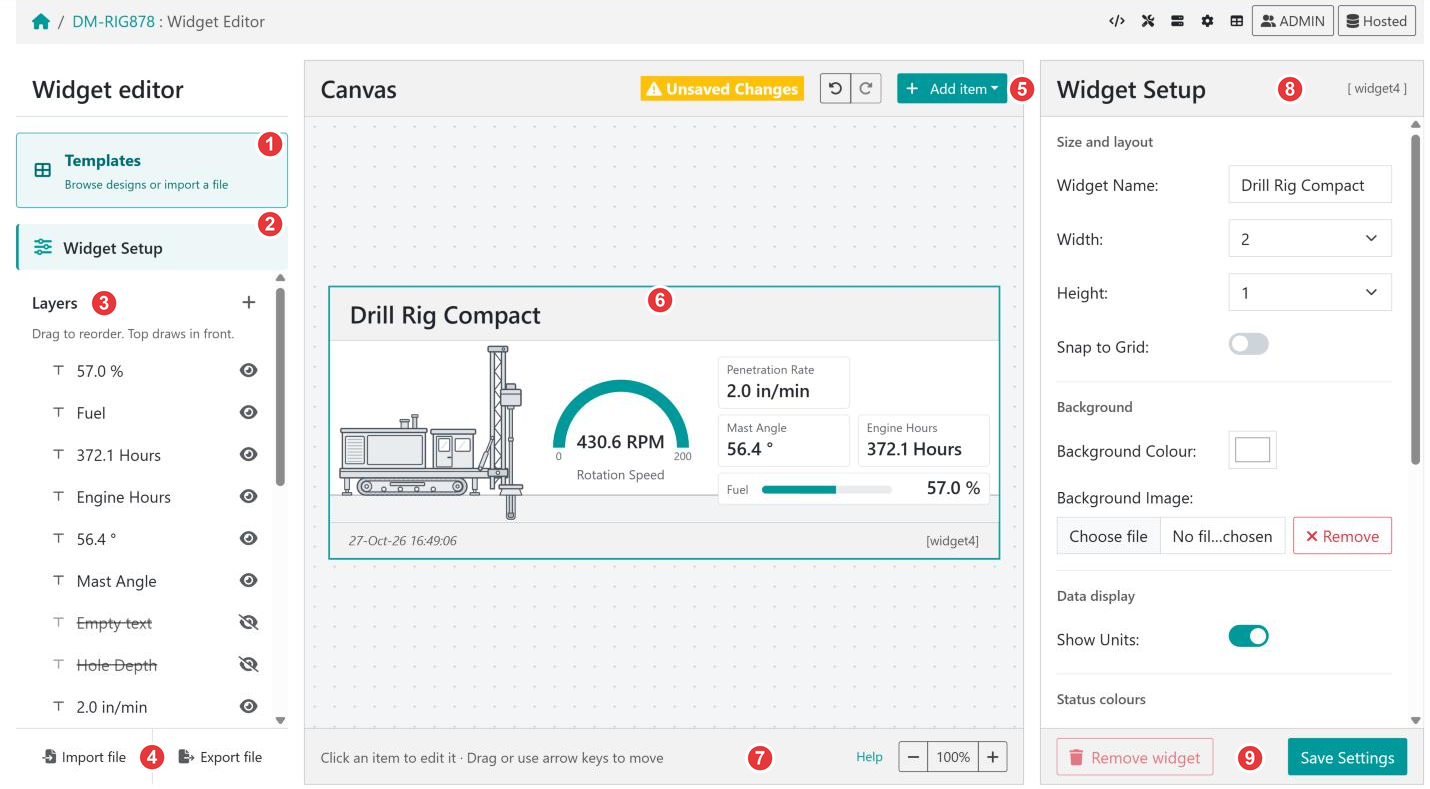
The editor has three columns: the widget’s items on the left, a live preview of the widget in the middle, and the settings for whatever is selected on the right.
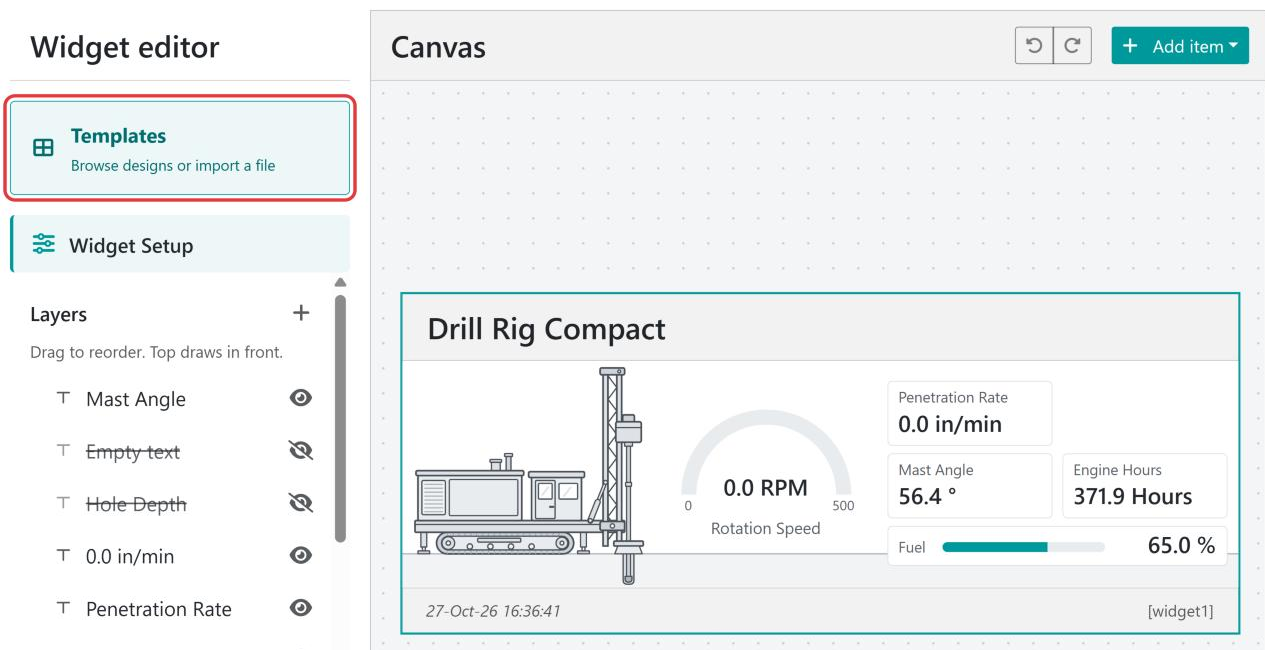
Templates opens the template library, where you can start from a ready-made design or import a widget file.
Widget Setup shows the settings for the widget itself: its name, size, background, and status colours. Clicking an empty part of the canvas does the same.
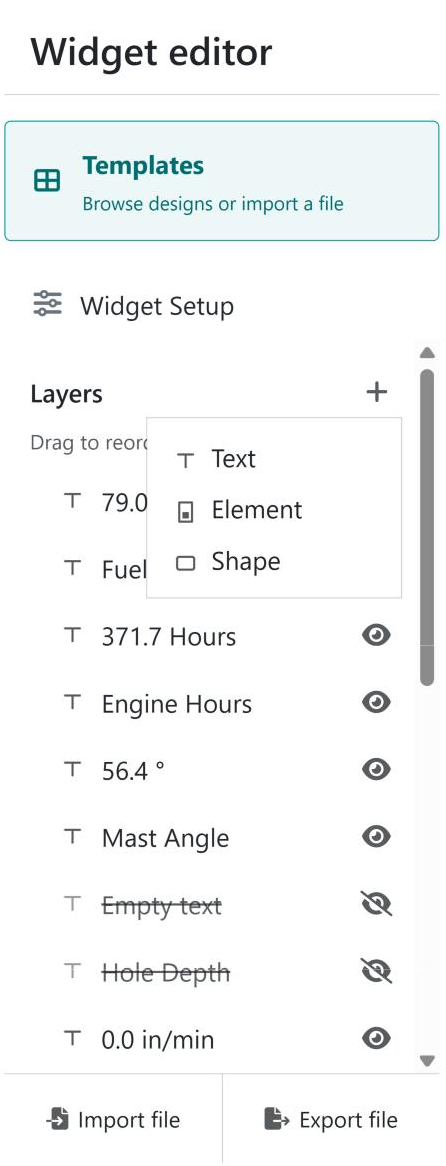
Layers lists every text, element, and shape in the widget, front to back. Select an item to edit it, drag items to change which draws in front, and use the eye icon to hide or show an item. The + button adds a new item.
Import file and Export file load a widget from a file, or download this widget as a file.
The canvas toolbar shows Unsaved Changes when there is something to save, the Undo and Redo buttons, and Add item.
The canvas shows the widget as it will look on the device page, using the device’s latest data. Click an item to select it, and drag it to move it.
The bar under the canvas has a reminder of how to move items, a Help link to this guide, and the zoom controls.
The settings panel shows the settings for the selected item, or Widget Setup when nothing is selected. The item’s key, such as [wt6] for a text or [we1] for an element, is shown in its top right corner.
Save Settings stores the widget on the device. Remove widget deletes it from the device.
In this example we build a widget for a drill rig, DM-RIG878. The device reports head speed, penetration rate, mast angle, engine hours, and fuel level, and we want them on one card the same height as the other widgets on the device page.
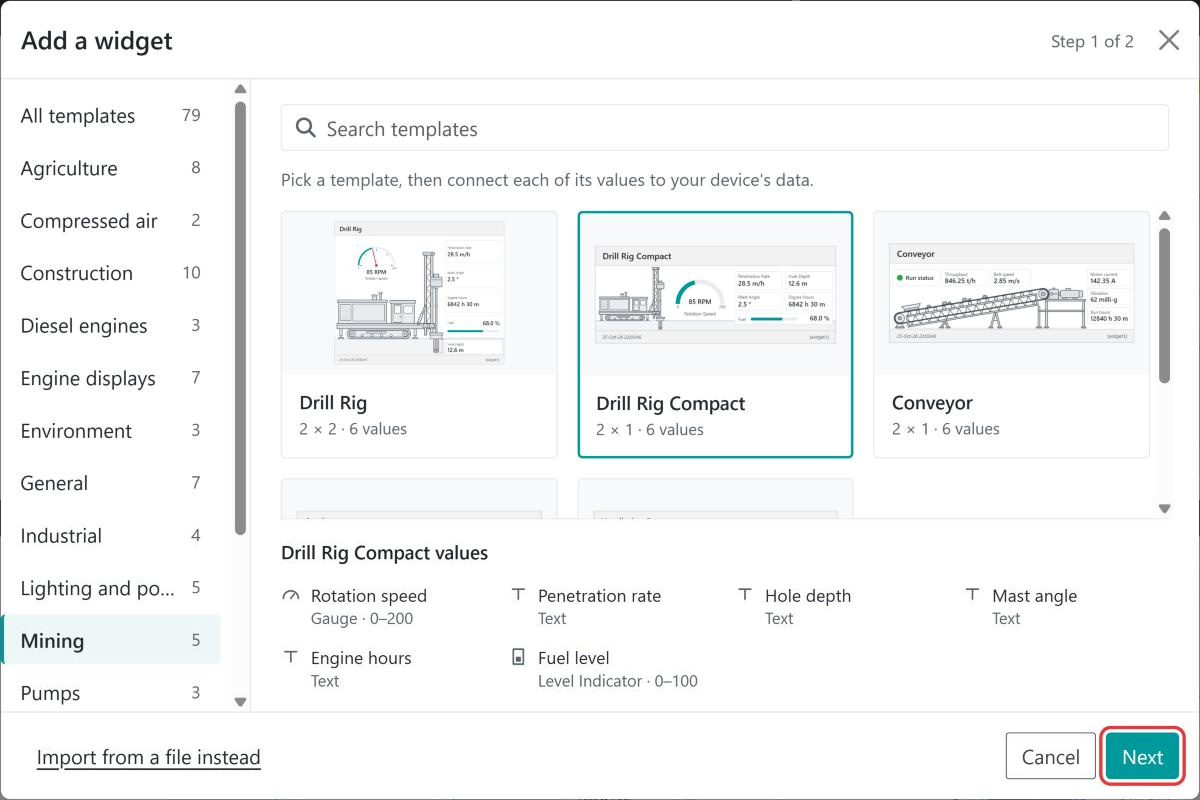
The template library opens on Step 1 of 2. Pick a category on the left or type in Search templates, then select a template to see the values it needs. We choose Drill Rig Compact from the Mining category. It is 2 × 1, two widgets wide and one high, and has six values. Select Next.
Choose a template, then select Next. The list at the bottom shows what each value is drawn as.
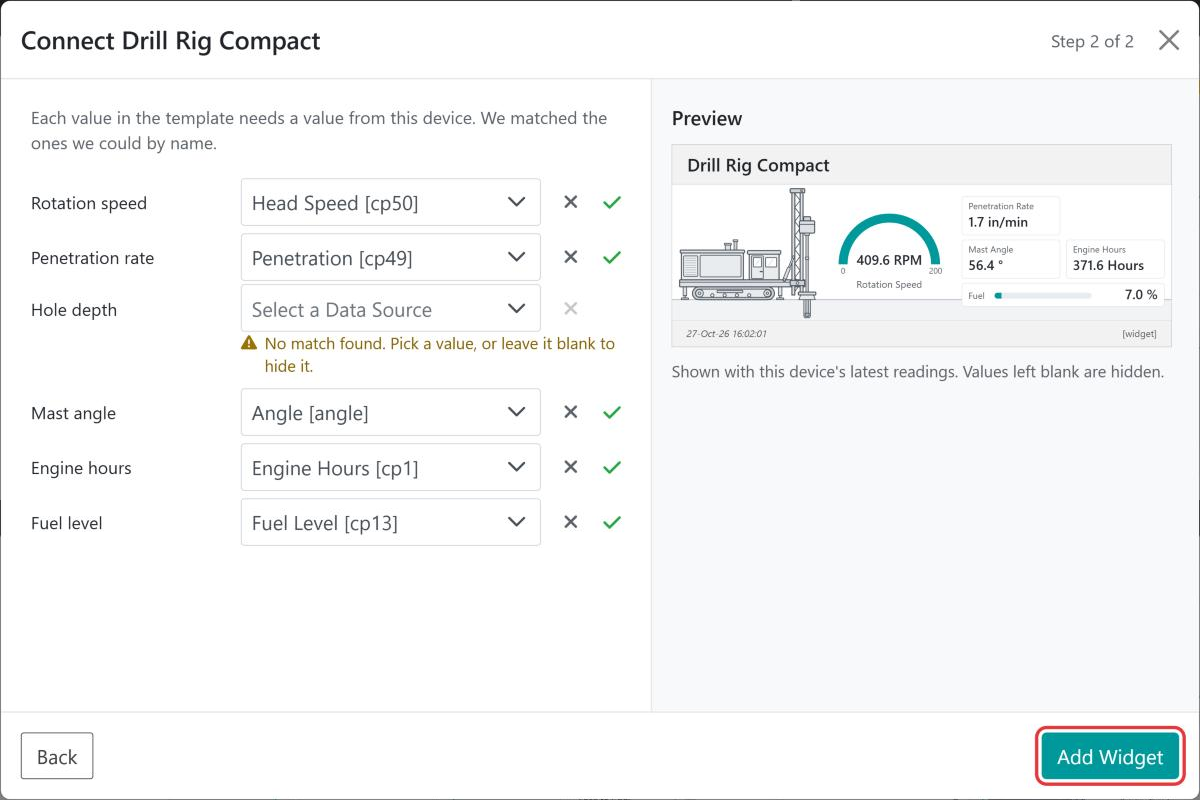
Step 2 – Connect the values to the device’s data
The editor matches each value in the template to the device’s data by name, and shows a preview using the device’s latest readings. Five of our six values were matched. Hole depth was not, because this device does not report hole depth.
select the ✕ to leave the value blank, which hides it in the widget
We leave Hole depth blank and select Add Widget. The widget appears on the canvas, named after the template. The hole depth text and its label are hidden, and are shown struck through in Layers so that they can be connected later.
Step 3 – Adjust the gauge to the machine
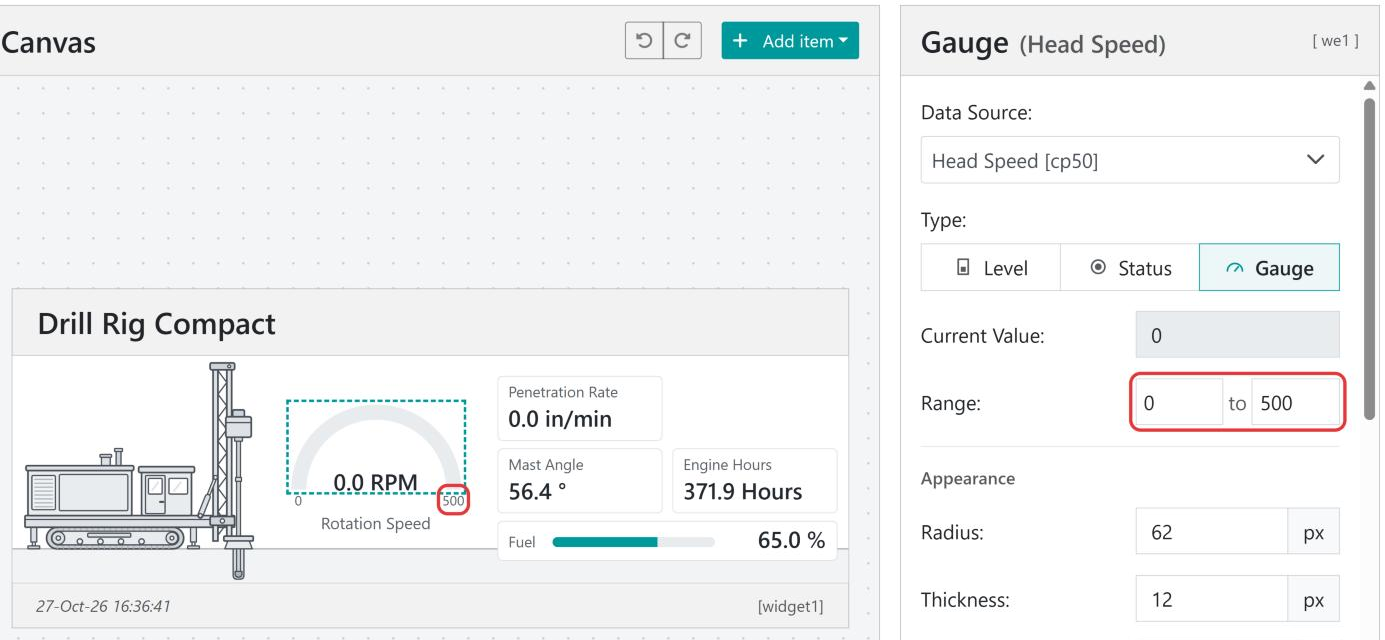
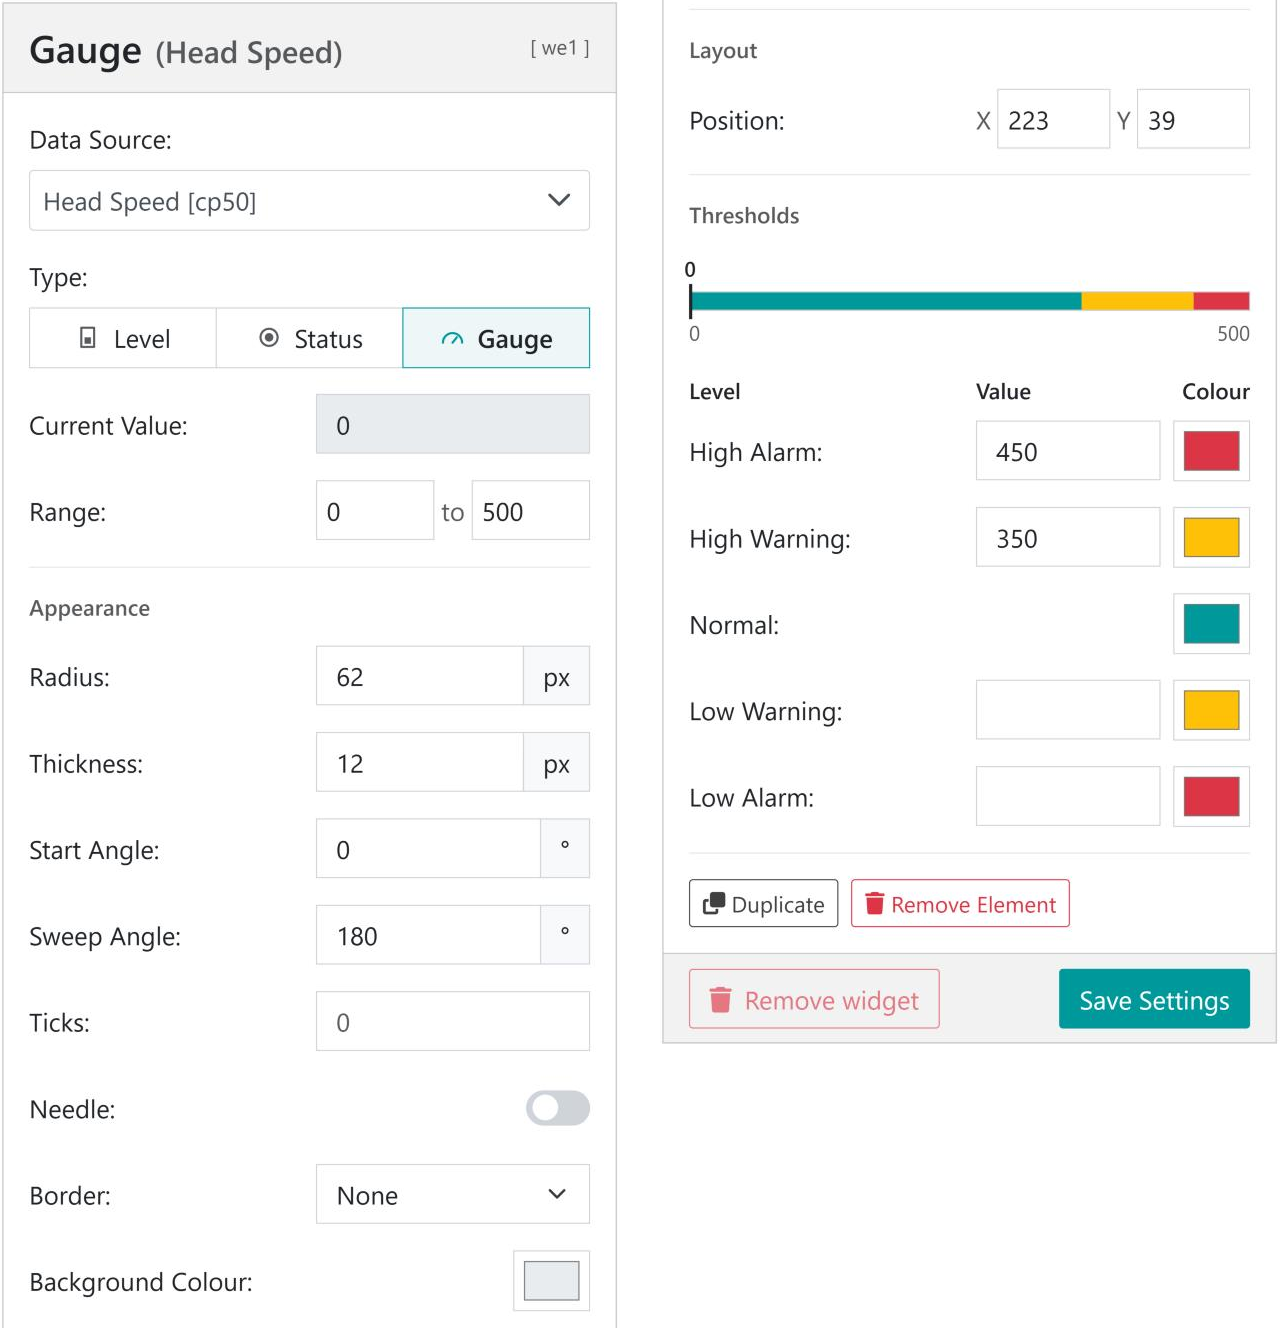
Templates use typical ranges, which may not suit your machine. The rotation speed gauge runs from 0 to 200 RPM, but this rig’s head turns at over 400 RPM, so the gauge would sit at full. Select the gauge, either on the canvas or as Gauge Head Speed in Layers, and set Range to 0 to 500.
The numbers at each end of the gauge are separate texts. Select the 200 text and change it to 500 to match.
Set the gauge’s Range, then update the end label to match
Step 4 – Add thresholds
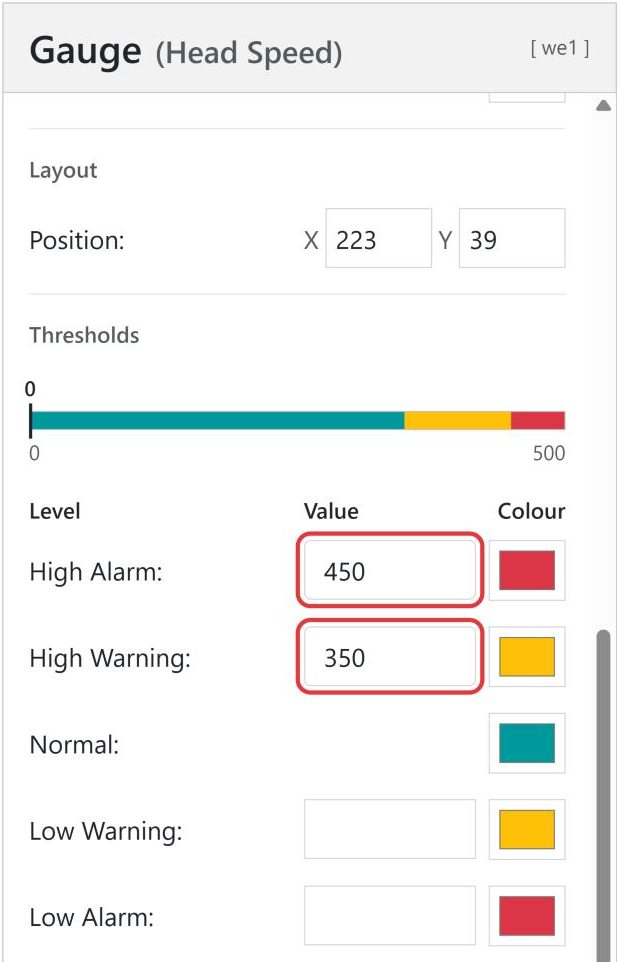
With the gauge still selected, scroll to Thresholds and set High Warning to 350 and High Alarm to 450. The bar above the threshold table shows the bands across the range. On the widget, the gauge turns amber above 350 RPM and red above 450 RPM.
Unsaved Changes shows above the canvas. Select Save Settings at the bottom of the settings panel. The widget is stored on the device and appears on the device data page.
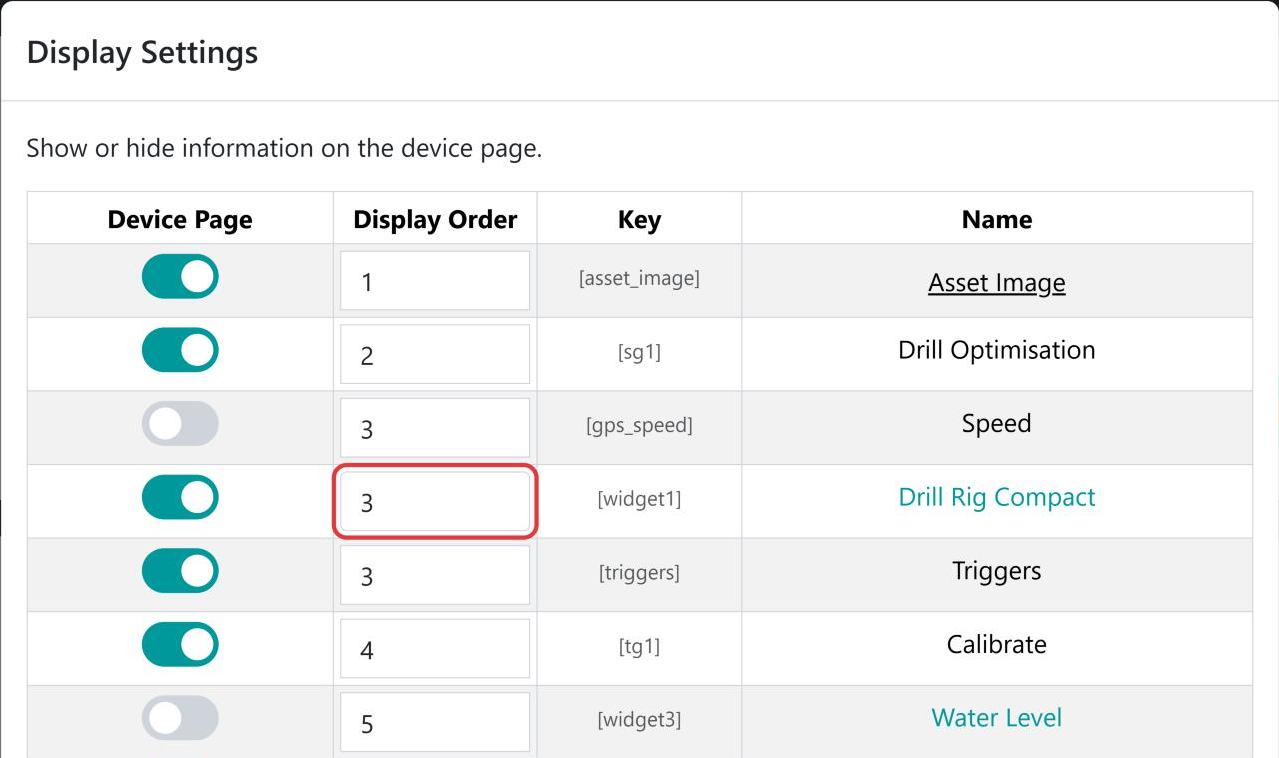
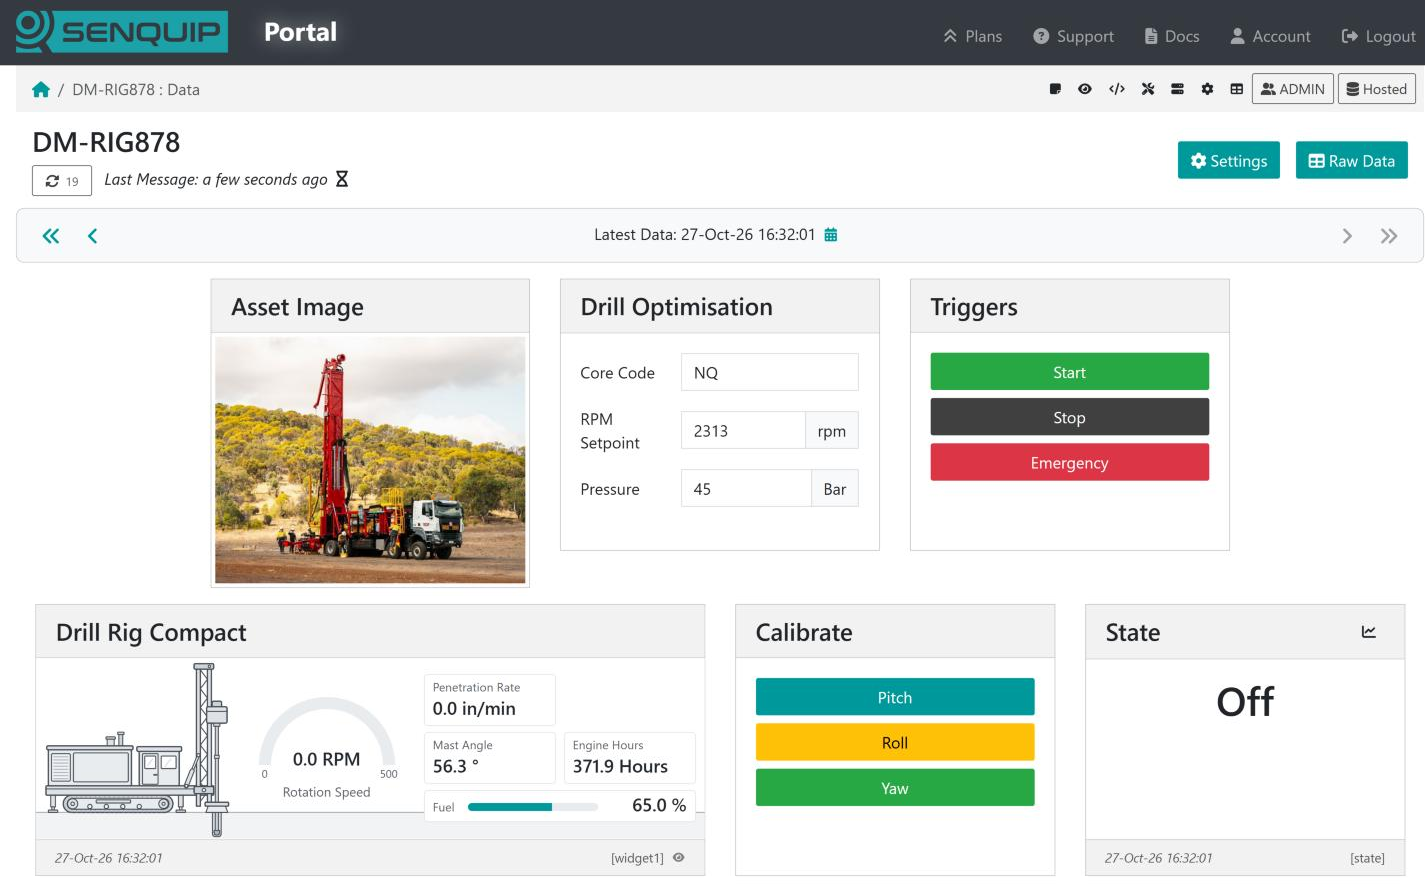
A new widget is added near the end of the device page. To move it up, open Display Settings, set the widget’s Display Order, and select Apply. We set ours to 3, which places it after the Asset Image and Drill Optimisation widgets.
Set the widget’s Display Order in Display Settings
Because the widget is one unit high, it lines up with the widgets next to it.
A new widget starts as the Big Number template from the General category, showing the device’s internal temperature as a large number, with a level bar and a status light. You can build on it, or replace it from another template or a widget file. Either way replaces the current design, and nothing is stored until you select Save Settings. If you change your mind, use Undo.
From a template
The template library holds ready-made widgets for common machines and instruments, grouped into categories such as Agriculture, Construction, Engine displays, Mining, Pumps, Tanks, and Vehicles. Each card shows the template’s size in widget units and how many values it needs. The General category has simple designs, such as a big number, a thermometer, or a status panel, that suit any device.
Matching is by name, so a template connects best when the device’s data sources have clear names such as Fuel Level or Engine Hours. You can rename data sources in the device’s settings before opening the library.
Note
The preview in step 2 uses the device’s latest readings. If a value is stale, or the device is reporting a warning or alarm for it, a note under the preview says so.
From a widget file
Select Import file, or Import from a file instead in the template library, and choose a widget file exported from this or another device. See Exporting and Importing Widgets.
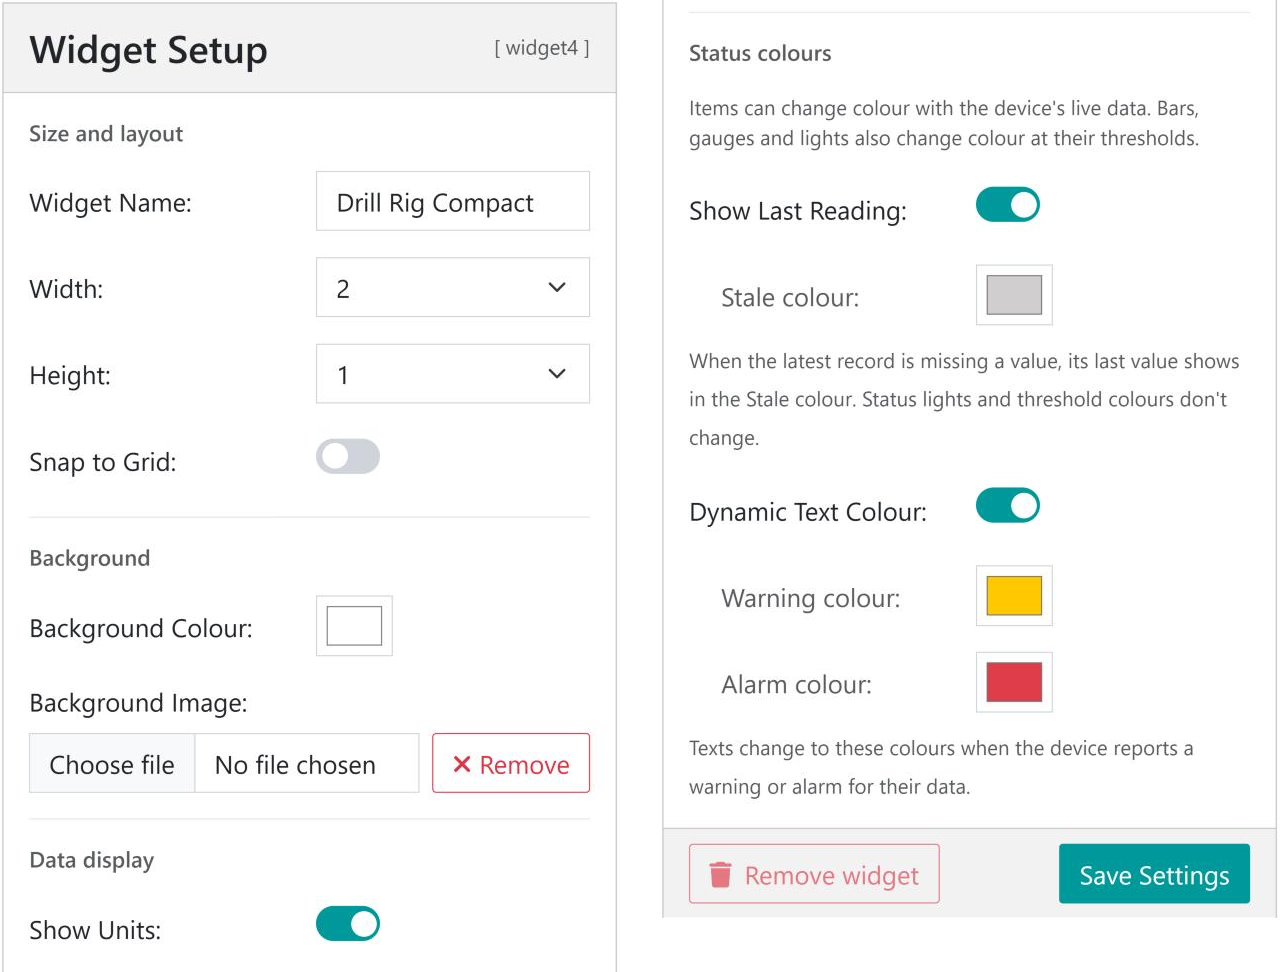
Widget Setup holds the settings for the widget as a whole. Select Widget Setup in the left column, or click an empty part of the canvas, to show it. Clicking the widget’s title on the canvas also takes you to its name.
The title shown at the top of the widget, up to 50 characters.
Width
1 to 4 standard widgets wide.
Height
Auto, or 1 to 4 standard widgets high. With Auto, a background image sets the height (see below).
Snap to Grid
When on, dragged items snap to a 5 pixel grid.
Background Colour
The colour behind everything in the widget.
Background Image
A PNG or JPEG picture drawn behind the widget’s items, up to 300 kB. Remove takes it off again.
Show Units
Adds each value’s units after the number, such as 79.0 % rather than 79.0.
Show Last Reading
When the latest record has no value for an item, show its last value in the Stale colour. When off, the
value shows as ???.
Dynamic Text Colour
Texts change to the Warning colour or Alarm colour when the device reports a warning or alarm for the
data they show. When off, texts keep their own colour.
A widget one unit high lines up with the standard widgets on the device page, which makes for a neat and consistent page. The picture is drawn in the widget’s body, the area between the title bar and the footer. For a widget one unit high, the body is the size shown below.
Widget width
Body width
Body height
Ratio
Suggested image size (2×)
1
318 px
181 px
1.76
636 × 362 px
2
668 px
181 px
3.69
1336 × 362 px
3
1018 px
181 px
5.62
2036 × 362 px
4
1368 px
181 px
7.56
2736 × 362 px
The ratio is what matters. The picture is scaled to the widget’s width, so any image with the right ratio fits.
Drawing the picture at twice the body size keeps it sharp on high resolution screens, as long as the file stays under 300 kB. Use PNG for drawings and JPEG for photographs.
With Height set to Auto, the picture’s ratio sets the widget’s height. A picture taller than the ratio above makes a taller widget.
With Height set to a number, the picture is scaled to fit inside the body without stretching, so a picture with the wrong ratio leaves empty bands at its sides or top and bottom.
For widgets two, three, or four units high, the body is 469, 757, or 1045 px high.
Note
The background image is uploaded when you select Save Settings, not when you choose the file.
Elements draw a value as a level bar, a status light, or a gauge.
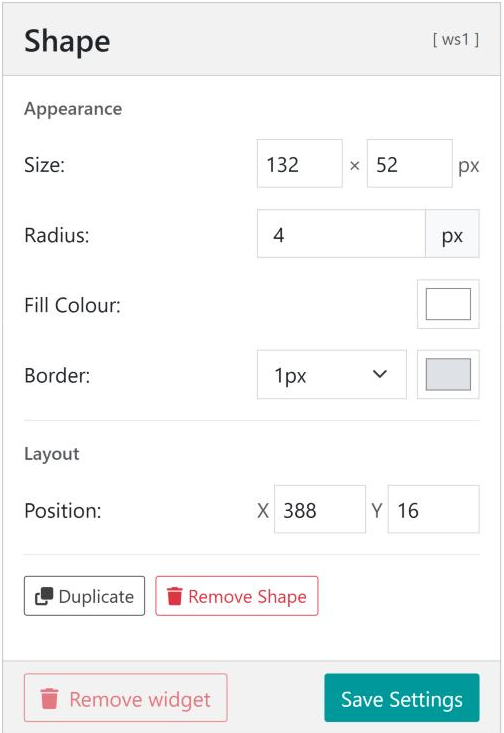
Shapes are plain rectangles, such as panels behind a group of readings.
Add an item with Add item above the canvas, or with + in Layers, and choose Text, Element, or Shape. The new item is selected and its settings open on the right. Every item’s panel has Duplicate and Remove buttons at the bottom.
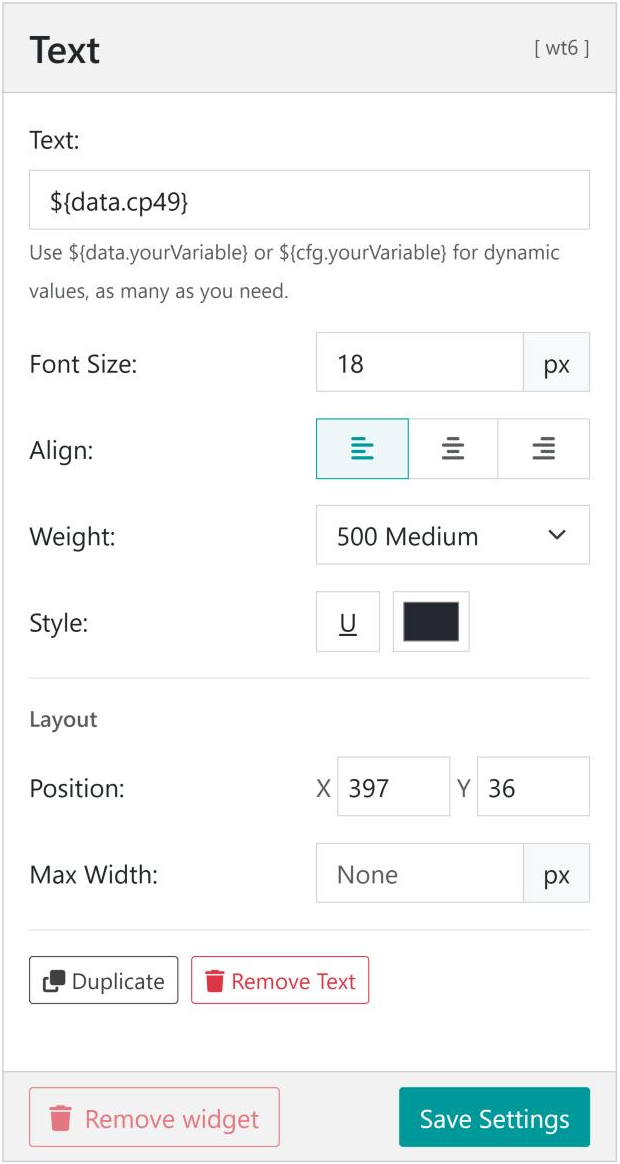
Type plain text, live values, or both in the Text box, up to 100 characters. A live value is written as a dollar sign and curly brackets around the source of the value:
${data.key} inserts the latest value of a measurement. The key is the code shown in square brackets after each data source’s name in the data source lists, such as cp49 in Penetration [cp49].
${cfg.key} inserts a value from the device’s configuration, such as ${cfg.device.name}.
Text
Shows
${data.cp49}
1.7 in/min
Fuel:${data.cp13}
Fuel: 79.0 %
${data.cp1}on${data.cp13}
371.7 Hours on 79.0 %
${cfg.device.name}
DM-RIG878
Depth:${data.nosuchkey}
Depth: ???
Values use the units and decimal places set for that measurement on the device. Turn off Show Units in Widget Setup to show numbers only. ??? means the device has no value for that key.
Appearance and layout
Setting
What it does
Font Size
In pixels. The list suggests common sizes, or type your own.
Align
Left, centre, or right. Changing the alignment keeps the text where it is on the canvas.
Weight
From 100 Thin to 900 Black. 400 Regular is normal text and 700 Bold is bold.
Style
U underlines the text. The colour box sets the text colour.
Position
X and Y, in pixels from the top left corner of the widget’s body.
Max Width
Wraps the text onto more lines when it is wider than this. Leave empty for no limit.
Note
The position of a centred text is its centre, and the position of a right aligned text is its right edge. Centre or right align values whose width changes, so they grow evenly or away from a label instead of over it.
Elements draw a single numeric value. Choose the Type at the top of the element’s panel; the panel shows the settings for that type.
Level draws a bar that fills from Range minimum to maximum. Rotation turns the bar by 0°, 90°, 180°, or 270°.
Status draws a light that changes colour at the thresholds, which suits on and off states and alarms.
Gauge draws an arc that fills from Range minimum to maximum. Set Start Angle and Sweep Angle to shape the arc, add Ticks, and turn on Needle for an instrument style dial.
The measurement the element shows. Only numeric data sources are listed.
Current Value
The latest value, so you can check the source and range.
Range
The values at the empty and full ends of a level bar or gauge. The maximum must be more than the minimum.
Size
Width and height of a level bar or status light, in pixels.
Radius
Corner rounding for a level bar or status light, or the size of a gauge.
Thickness
The width of a gauge’s arc.
Border
None, or 1 to 5 pixels, with its colour.
Shadow
A drop shadow under a status light.
Background Colour
The colour of the unfilled part of a level bar or gauge.
Position
X and Y, in pixels from the top left corner of the widget’s body.
Thresholds
Each element can have a High Alarm, High Warning, Low Warning, and Low Alarm value, each with its own colour, plus a Normal colour. The element takes the colour of the band its value is in. The bar at the top of the section shows the bands across the range, with a marker at the current value. Leave a threshold empty if you do not need it.
Note
Element thresholds are set in the widget and only change the element’s colour. They are separate from the warnings and alarms configured on the device, which change text colours (see Status Colours) and can send notifications.
Shapes are rectangles with a fill colour, an optional border, and rounded corners. Use them as panels behind a group of readings, as dividers, or, with a large radius, as circles.
Layers lists every item, with the item at the top drawn in front. Texts show their text, and elements show their type and data source.
Drag an item up or down the list to change what draws in front. Shapes used as panels need to be below the texts that sit on them.
Select the eye icon to hide an item. Hidden items stay in the widget, struck through in the list, but are not shown on the device page. Select the eye again to show the item.
Select an item to edit it. This is the easiest way to reach a small item, or one hidden behind another.
Drag an item on the canvas to move it. Items stay inside the widget.
Alignment guides appear as you drag, and the item snaps to the edges and centres of the other items and of the widget when it comes within a few pixels.
Snap to Grid, in Widget Setup, snaps positions to a 5 pixel grid instead.
Arrow keys move the selected item 1 pixel, or 10 pixels with Shift.
Position in the item’s panel places it exactly, in pixels from the top left corner of the widget’s body.
Zoom with the − and + buttons under the canvas, or hold Ctrl and scroll over the canvas. Zooming runs from 50% to 400%. Select the percentage to go back to 100%.
Widgets can show the state of the device at a glance:
Stale values. When the latest record from the device does not include a value, and Show Last Reading is on, texts and elements show the last value received in the Stale colour, light grey by default.
Device warnings and alarms. When Dynamic Text Colour is on and the device reports a warning or alarm for a value, texts showing that value change to the Warning colour or Alarm colour.
Element thresholds. Level bars, gauges, and status lights change colour at their own thresholds.
Because the canvas uses the device’s live data, a widget may show status colours while you are editing it. When it does, a note above the widget says how many items are affected and why, with a link to Status colours in Widget Setup. The note can be dismissed.
Unsaved Changes shows above the canvas whenever the widget differs from the version stored on the device. Select Save Settings to store it. Changes are kept only in the editor until then. Save Settings is greyed out when there is nothing to save.
Undo and redo
Use the Undo and Redo buttons above the canvas, or the keyboard shortcuts below, to step back through your changes. Typing in one box counts as one step, as does holding down an arrow key.
Export file downloads the widget as a .json file, including its background image. Import file loads a widget file into the widget you are editing, replacing its design. The imported widget is not stored until you select Save Settings.
Use widget files to:
copy a widget to other devices of the same kind
keep a copy of a widget before making large changes
share a design with another user
A widget file holds the design only, not where the widget sits on the device page. Widget files can be up to 1 MB.
Note
Live values refer to data keys such as ${data.cp13}. When a widget is imported on a device that uses different keys for the same measurements, select each text and element and update its data source.
Removing a widget
Remove widget deletes the widget and its background image from the device, after you confirm. This cannot be undone, so export the widget first if you may want it again.
Start from a template, even a rough match. It is quicker to delete or rearrange items than to place them from scratch, and the template’s picture is already sized to the widget.
Keep widgets one unit high. A 2 × 1 or 3 × 1 widget lines up with the rest of the device page. Use a wider widget, rather than a taller one, for long machines.
Put readings next to what they measure. A value beside the tank, motor, or belt it measures is read faster than one in a list. Group general readings such as hours and battery in tidy panels using shapes.
Check every range. Set Range to the machine’s real operating range, then update the template’s end labels, which are separate texts.
Repeat rows quickly. Select an item and press Ctrl + D. Each copy lands slightly offset, so you can see it, ready to move with the arrow keys.
Copy between widgets. Copy an item in one widget, open another widget in the same browser tab, and paste it there. After a cut, pasting puts the item back where it was.
Zoom in for fine work. At 200% or more it is easy to line items up to the pixel.
Hide rather than remove. A hidden item keeps its settings, which is handy for a reading that a device does not have yet.
Centre values under gauges. Centre aligned values stay centred under the gauge however many digits they have.
Use Max Width for long labels. The text wraps instead of running over other items.
Name data sources clearly. Clear names, such as Fuel Level, make template matching work and make the data source lists easier to read.
Export before big changes. A widget file is a complete backup of the design, picture included.
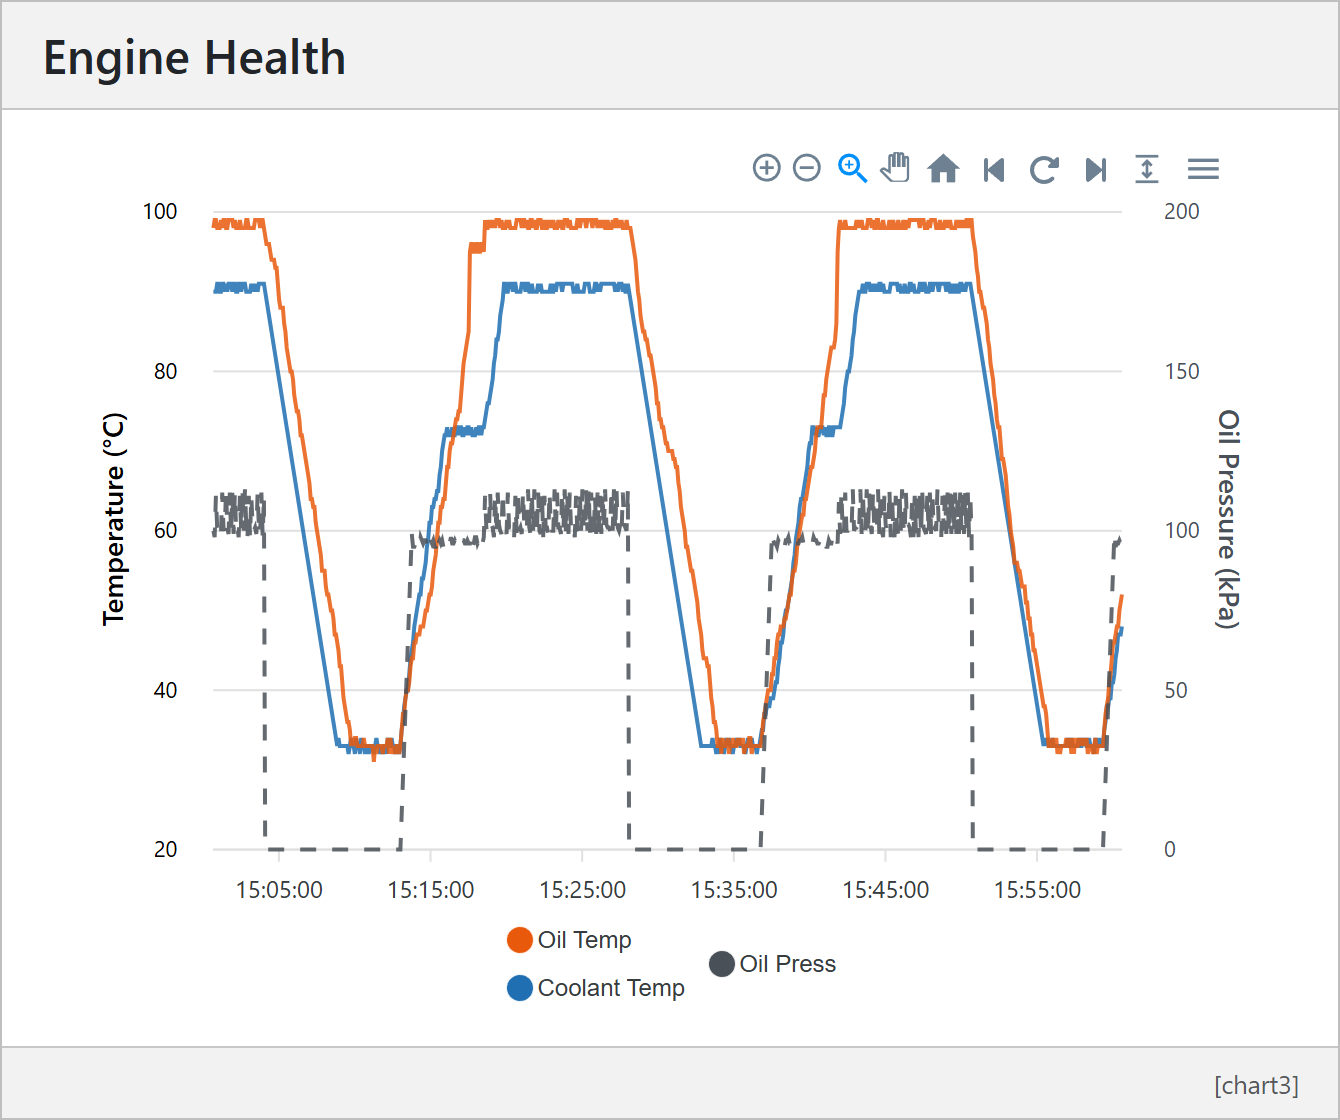
Custom charts plot a device’s measurements over time on the device data page. A chart can be a line, area or bar chart, with up to 4 y-axes and up to 8 series, and each device can have up to 8 custom charts. In the example below, coolant and oil temperature are plotted against the left axis and oil pressure, as a dashed line, against the right axis.
To speed up rendering, line and area charts are downsampled to about 1,000 points across the chart. The downsampling keeps as many features of the original data as possible, but details can be smoothed out on a long timeline. Use Enhance zoomed area on the chart toolbar to reload a zoomed-in section at full resolution.
On the device data page, select the Display Settings icon (the eye) in the bar at the top of the page.
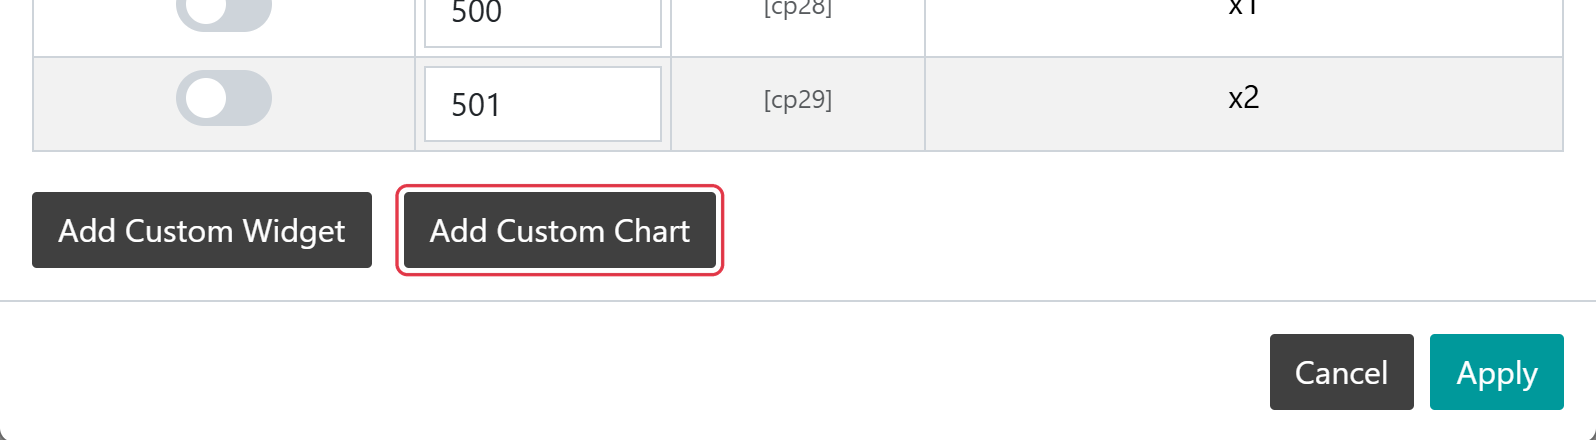
At the bottom of the Display Settings window, select Add Custom Chart. The Chart Editor opens with a new chart.
Add Custom Chart at the bottom of Display Settings
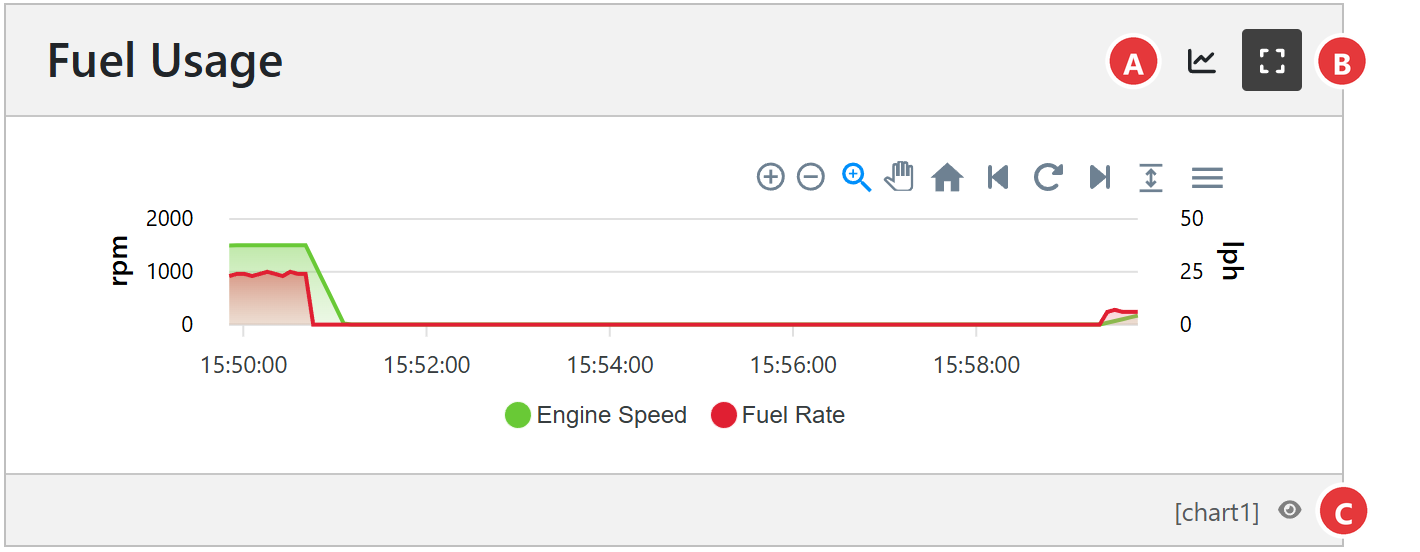
To edit an existing chart, select its name in the Display Settings window, or select the eye icon beside the chart’s key (for example [chart1]) in the bottom right corner of the chart on the device data page.
Note
Add Custom Chart goes straight to the editor and does not apply other changes made in the Display Settings window. Select Apply first if you have changed anything else there.
Note
Only users with the Admin or User role on the device can add or edit charts. A device can have up to 8 custom charts.
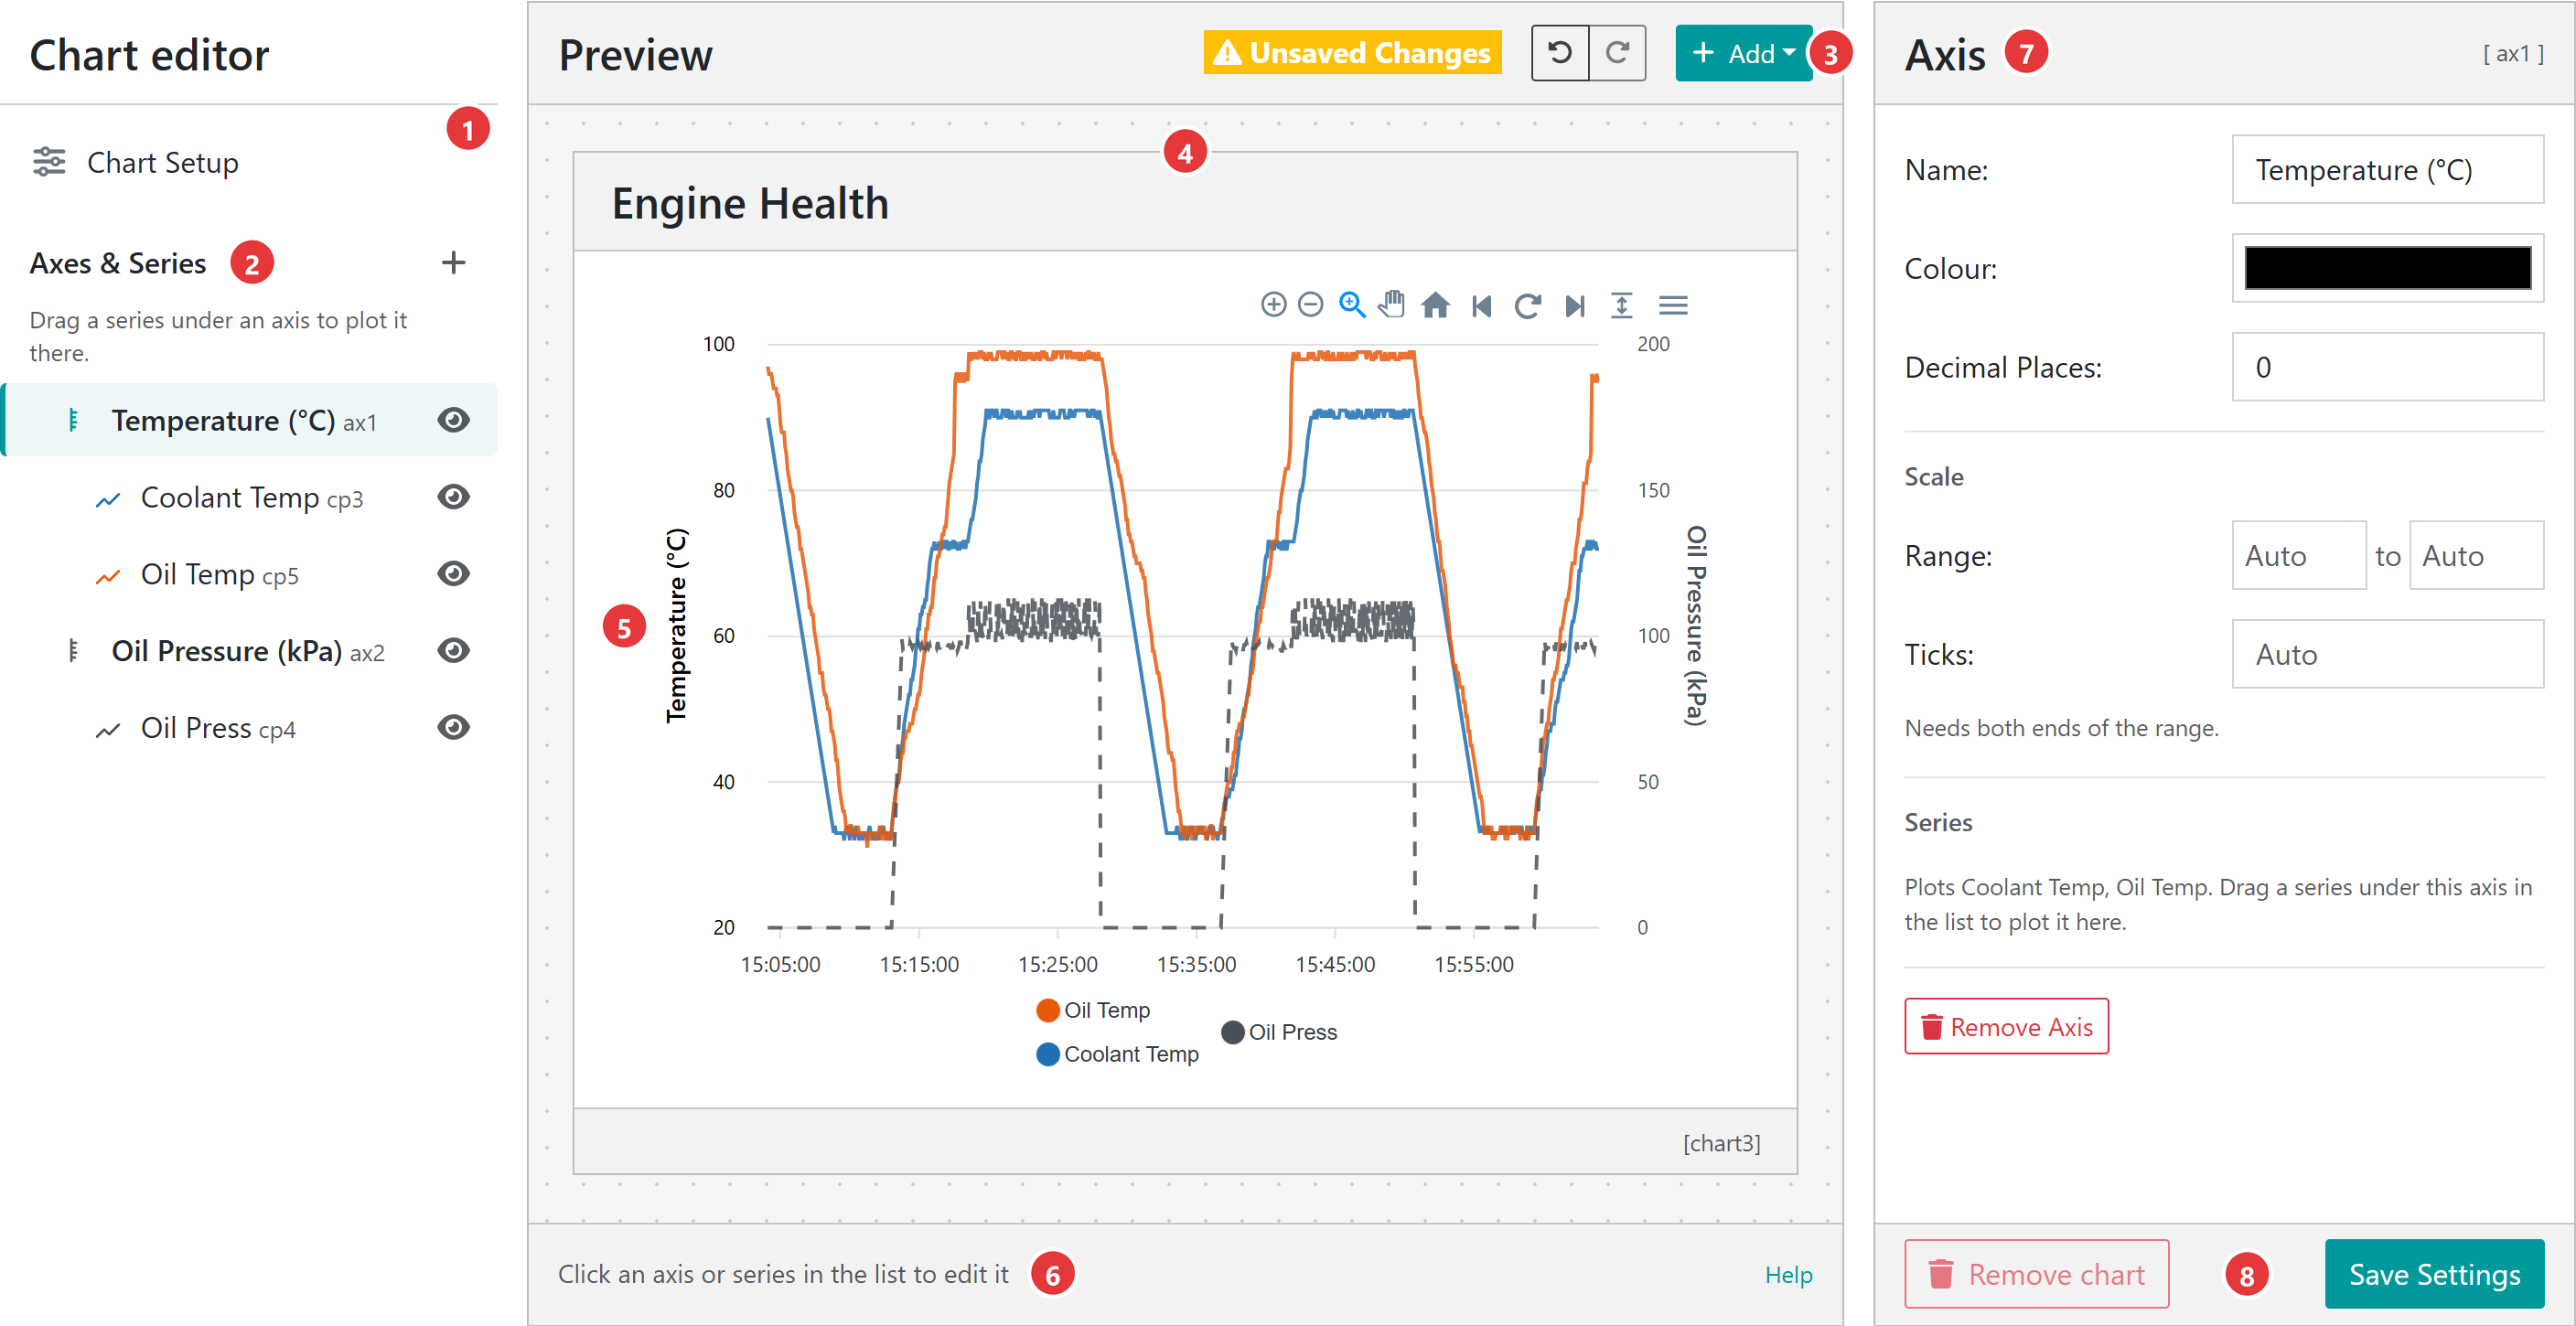
The editor has three columns: the chart’s axes and series on the left, a live preview of the chart in the middle, and the settings for whatever is selected on the right.
Chart Setup shows the settings for the whole chart: its name, type, size, colour and time range. Clicking the background around the preview does the same.
Axes & Series lists every axis, with the series plotted on it underneath. Select an item to edit it, drag a series under another axis to move it, and use the eye icon to hide or show it. The + button adds a series or axis.
The preview toolbar shows Unsaved Changes when there is something to save, the Undo and Redo buttons, and Add.
The preview shows the chart as it will look on the device data page, drawn with the device’s recent data.
Select an axis name on the preview to open that axis with its name ready to change.
The bar under the preview has a reminder of how to edit the chart, and a Help link to this guide.
The settings panel shows the settings for the selected item. The item’s key, such as [ax1] for an axis or [sr1] for a series, is shown in its top right corner.
Save Settings stores the chart on the device. Remove chart deletes it from the device.
A new chart starts as a 2 × 2 line chart named Chart N with a 30 minute time range and a single axis, Axis 1, plotting Supply Voltage.
In this example we build the chart shown at the top of this section for a generator, DM-GEN501. Its script reports coolant temperature (cp3), oil temperature (cp5) and oil pressure (cp4). The temperatures share one axis, and oil pressure, in different units, gets its own. Open the Chart Editor with Add Custom Chart as described above.
Step 1 – Name the chart and set its time range
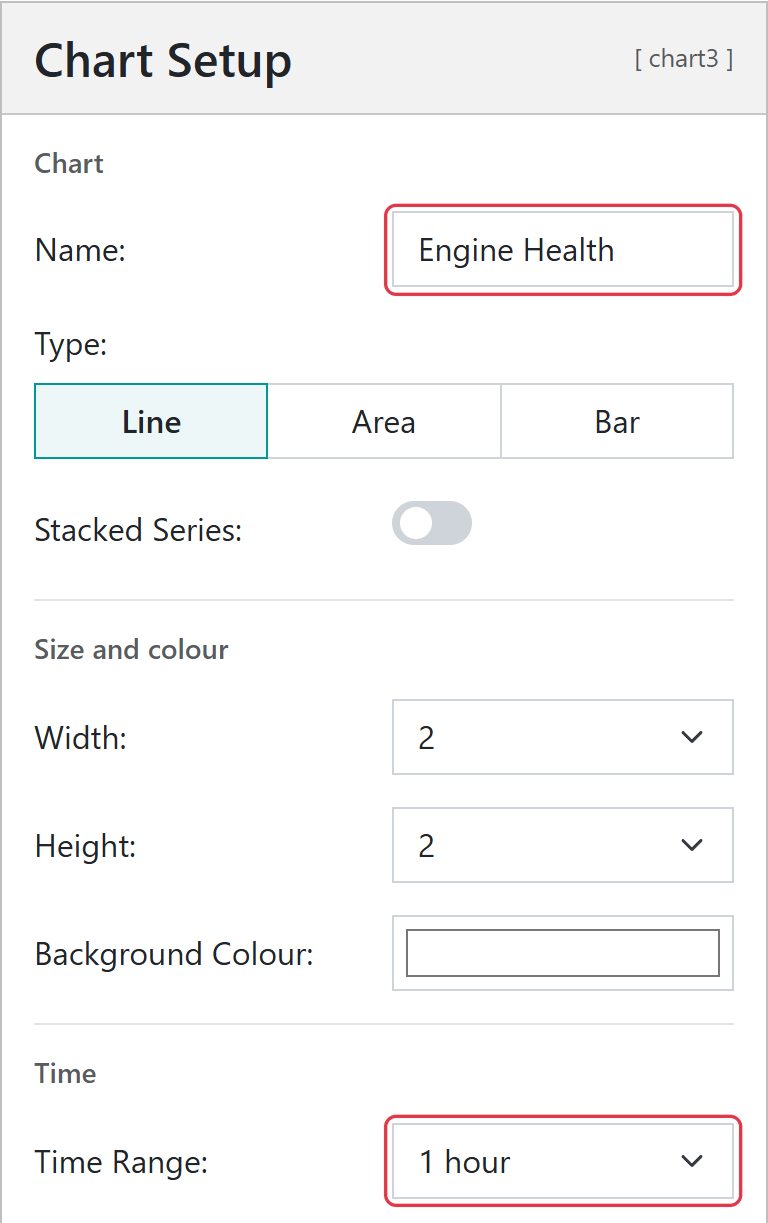
In Chart Setup, set Name to Engine Health, leave Type as Line, and set Time Range to 1 hour.
Name the chart and choose how much history it shows
Step 2 – Set up the temperature axis
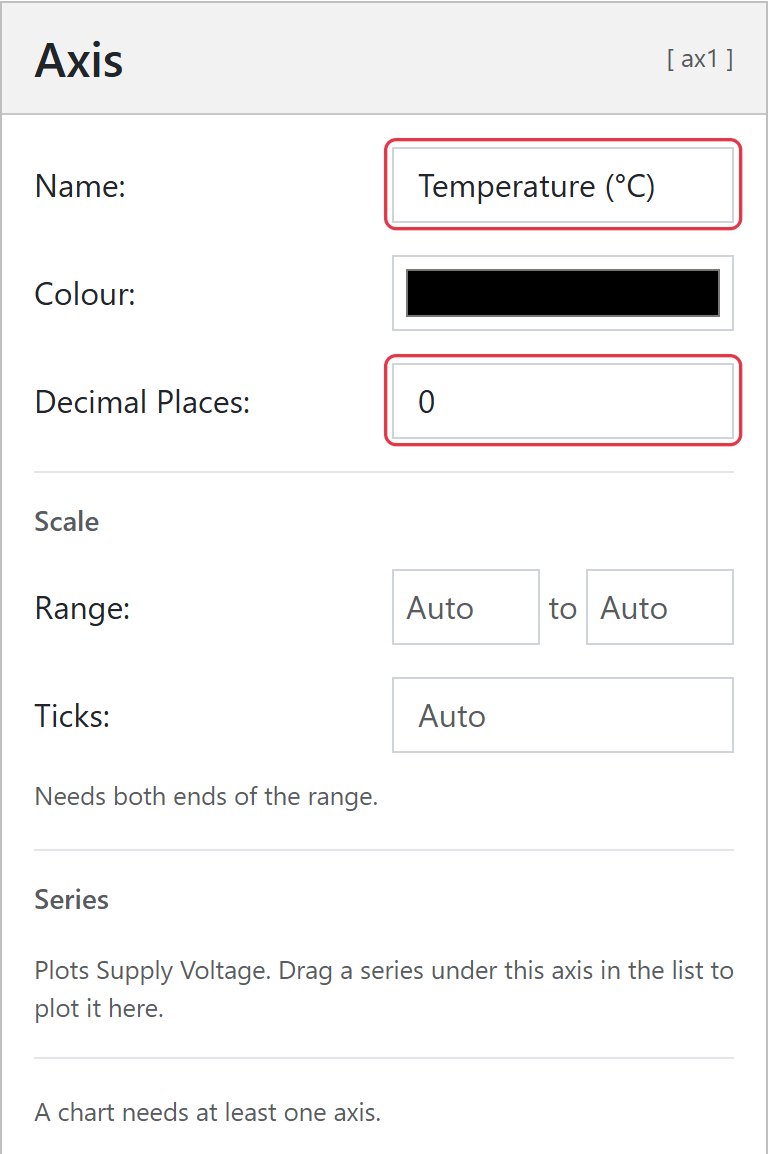
Select Axis 1 in Axes & Series. Set Name to Temperature (°C), including the unit as the axis does not add one, and set Decimal Places to 0. Leave Range as Auto so the axis fits the data.
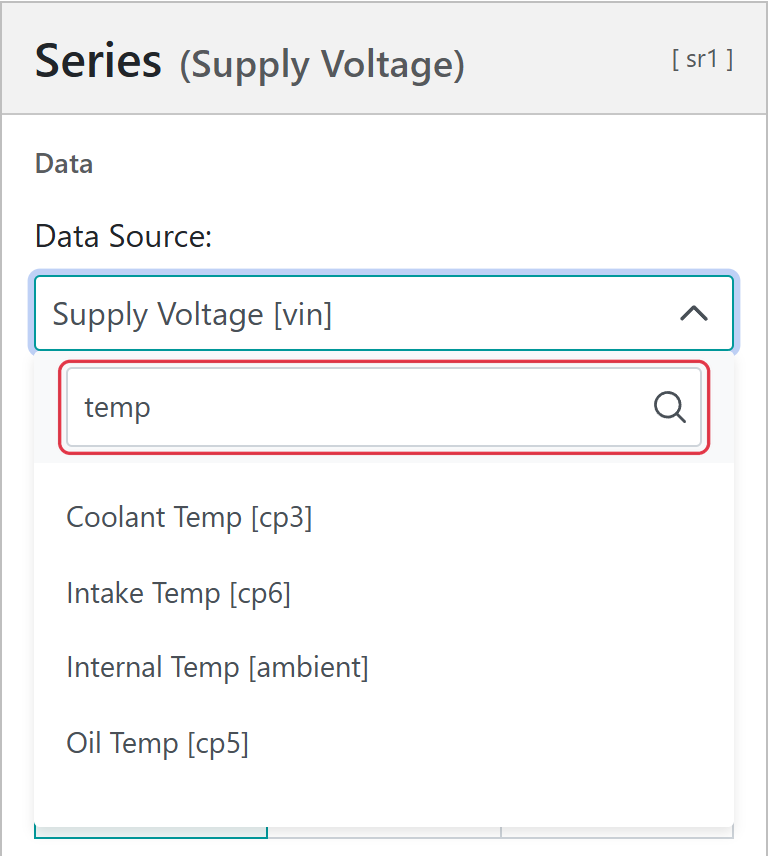
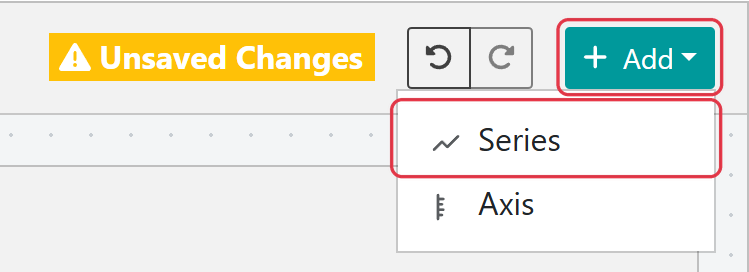
Select Add above the preview, then Series. The new series is added to the selected axis, so it plots against Temperature (°C). Set its Data Source to Oil Temp [cp5].
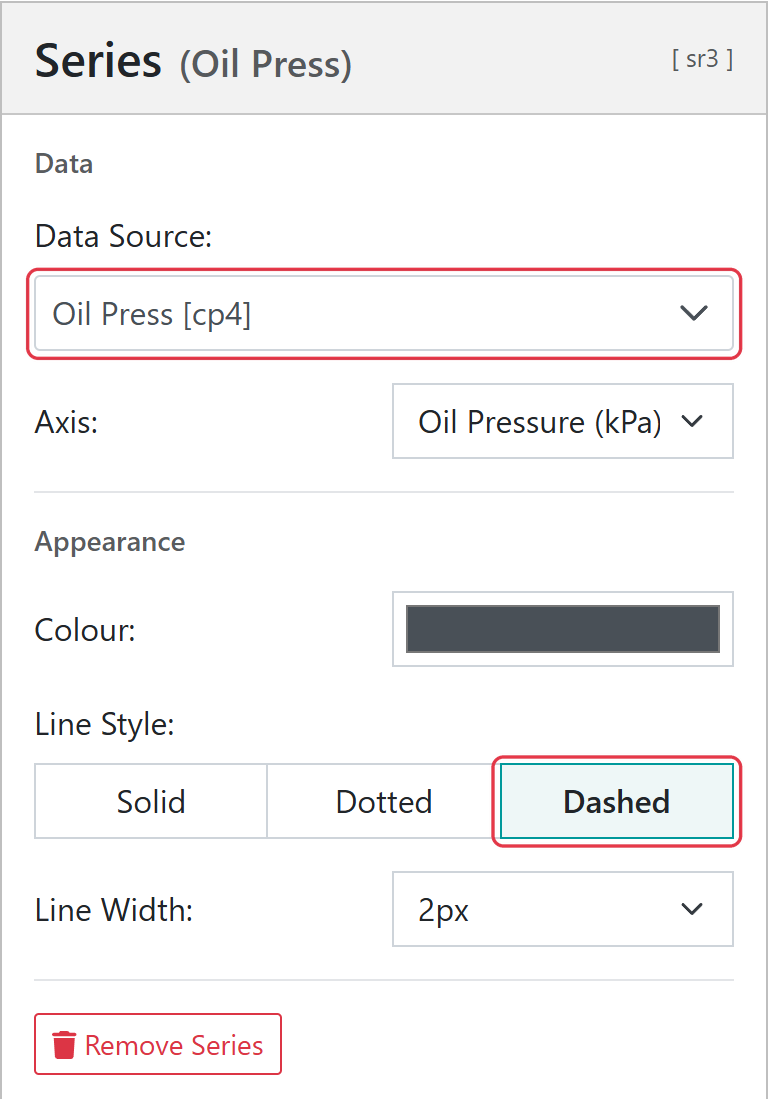
Select Add > Axis. Name the new axis Oil Pressure (kPa) and set Decimal Places to 0. With the new axis still selected, select Add > Series, set its Data Source to Oil Press [cp4], and set Line Style to Dashed so it stands apart from the temperatures. The second axis is drawn on the right of the chart.
The oil pressure series, on its own axis, drawn dashed
Step 6 – Choose colours and save
Choose a Colour for each series, then select Save Settings at the bottom of the settings panel. The chart is stored on the device and appears on the device data page alongside the other enabled widgets. To move it up the page, set its Display Order in Display Settings.
Select Chart Setup at the top of the left column, or the background around the preview, to change settings that apply to the whole chart.
Setting
What it does
Name
The title shown on the chart, up to 50 characters. A chart must have a name before it can be saved.
Type
Line, Area or Bar. Line and area charts plot readings over time; bar charts plot an array of numbers sent by the device’s script (see Bar Charts).
Stacked Series
Adds the series together so that the top of the stack is the total. All series are then plotted on the first axis in use; the other axes are crossed out in Axes & Series and their settings are kept for when stacking is turned off.
Width and Height
The size of the chart on the device data page, 1 to 4 standard widgets.
Background Colour
The colour behind the chart.
Time Range
Line and area charts only. How much history the chart shows when the page opens: 10 minutes, 30 minutes, 1 hour, 6 hours, 1 day or 1 week. Users can pick another range on the device data page.
Data Labels
Bar charts only. Shows each bar’s value on the bar, in the colour chosen beside the switch.
Each series plots one data source, and every series belongs to an axis. Several series can share an axis when their values are in the same units, such as two temperatures, and series on the same axis use one scale. The first axis is drawn on the left of the chart, the second on the right, and further axes alternate sides.
To add a series or axis, select + beside Axes & Series, or Add above the preview. A new series is added to the selected axis, or to the axis of the selected series, and is given an unused data source, which you can then change.
In the Axes & Series list:
Move a series to another axis by dragging it under that axis. You can also select its handle and use the up and down arrow keys. The order of the list is the order the series are drawn in.
Hide a series or axis with its eye icon. A hidden series is not plotted. A hidden axis hides its labels and title, but its series are still plotted against its scale.
Remove a series or axis with Remove Series or Remove Axis at the bottom of its settings. When an axis is removed, its series move to the first remaining axis. A chart always keeps at least one axis and one series.
Note
A chart can have up to 4 axes and 8 series.
Axis settings
Setting
What it does
Name
The axis title. Include the unit, for example Temperature (°C). Leave it blank for no title.
Colour
The colour of the axis title and labels.
Decimal Places
The number of decimal places on the axis labels, 0 to 5.
Range
The minimum and maximum of the axis. Leave both as Auto to fit the data, or set both ends; setting only one end is flagged in red.
Ticks
The number of labelled intervals on the axis, 1 to 20. Ticks only apply when both ends of the range are set.
The Series section of the axis settings lists the series plotted on it.
Series settings
Setting
What it does
Data Source
The measurement to plot, shown as Name [key], for example Oil Press [cp4].
Axis
The axis the series is plotted against. This is the same as dragging the series in the list.
Colour
The colour of the line, area or bar.
Line Style
Line and area charts only. Solid, Dotted or Dashed.
Line Width
Line and area charts only. 1 to 5 pixels.
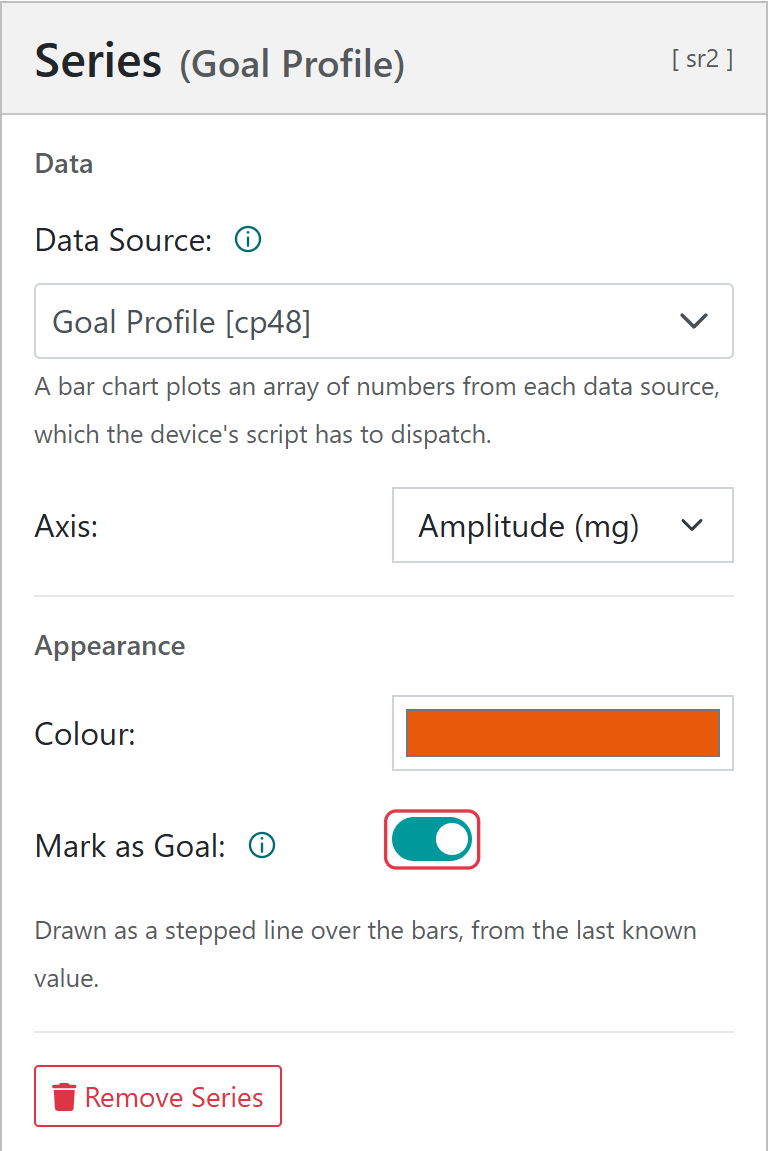
Mark as Goal
Bar charts only. Draws the series as a stepped goal line over the bars (see Bar Charts).
Choosing a data source
Select the Data Source box and type part of a name or key to search the device’s measurements. Line and area charts list measurements with numeric values; bar charts list measurements that are arrays of numbers.
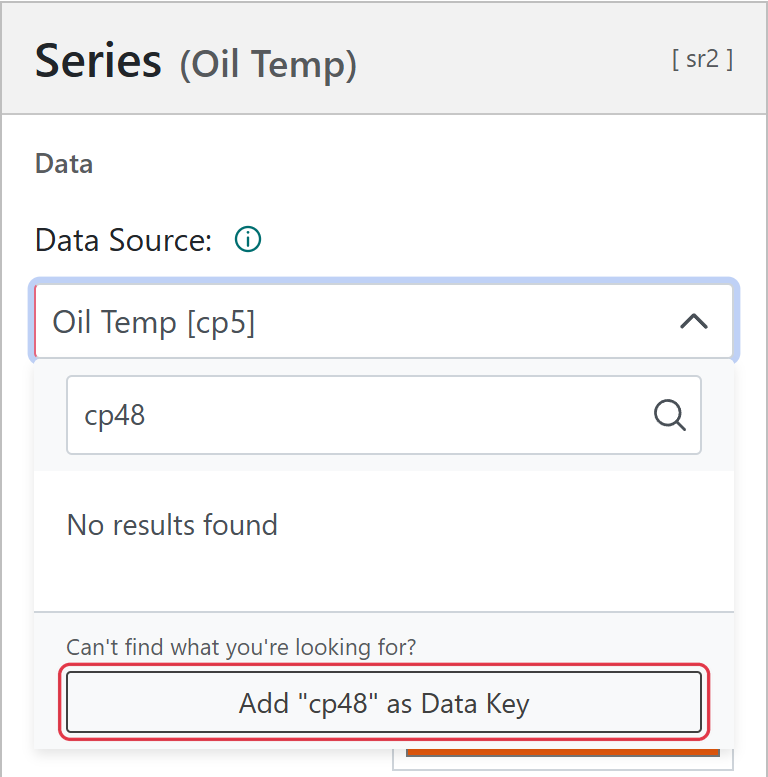
The list is built from the most recent message the device sent. A value that the device sends only now and then, such as a goal array, may not be in the latest message. To use it, type its key; if the portal recognises the key, select Add “key” as Data Key, then choose it from the list.
Index 1 sends the array as cp1, which is then chosen as the series’ data source. The bars show the values in the device’s latest message, or in the message selected when browsing history on the device data page.
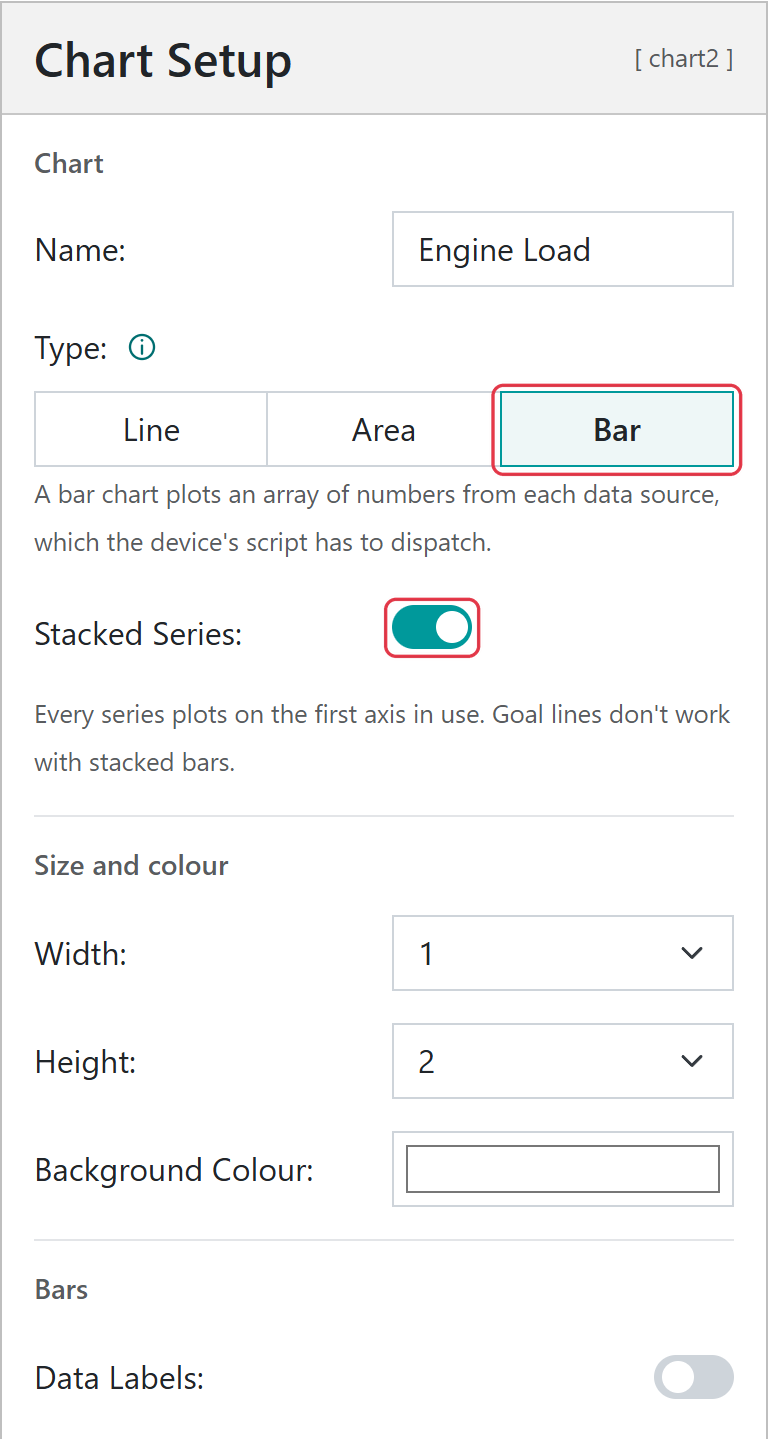
Select Bar as the chart’s Type. Stacked Series adds the series together, one segment per series in each column.
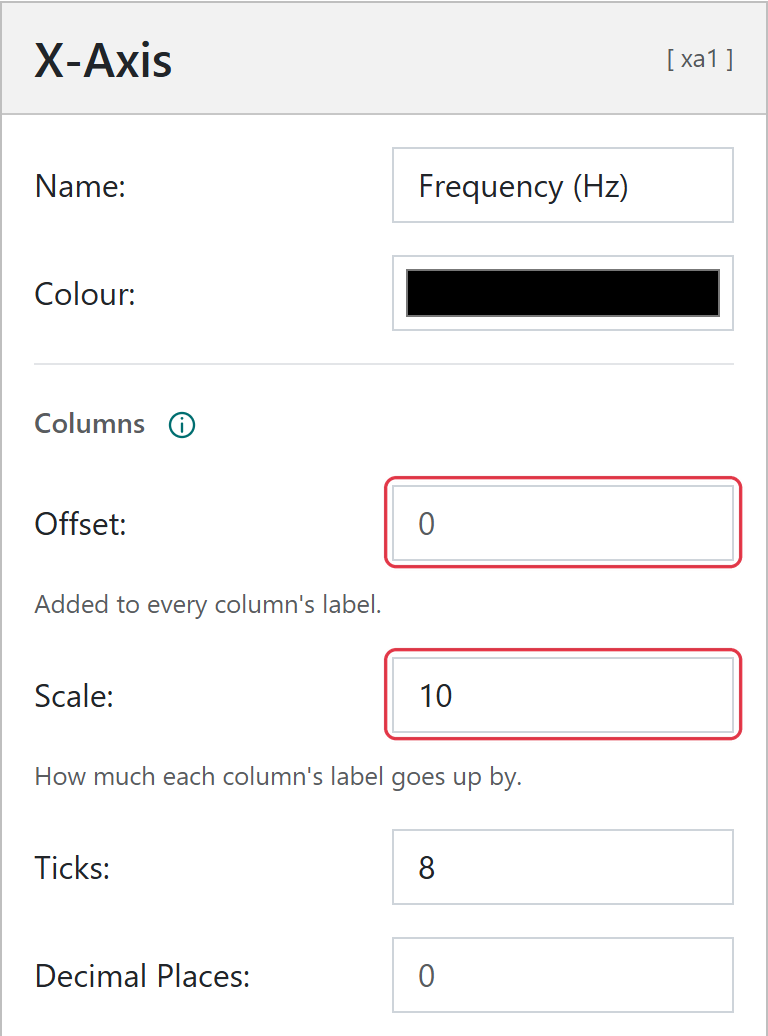
When Bar is selected, X-Axis appears in the left column. Use it to name the horizontal axis and to label the columns. Column 1, 2, 3 and so on is labelled with its number × Scale + Offset. For example, a Scale of 10 and an Offset of 0 label the columns 10, 20, 30 and so on.
The x-axis title. A new bar chart shows X-Axis until a name is set.
Colour
The colour of the x-axis title and labels.
Offset
Added to every column’s label.
Scale
How much each column’s label goes up by.
Ticks
How many column labels to show, 1 to 20.
Decimal Places
The number of decimal places on the column labels, 0 to 5.
Warning
Changing the chart type clears the X-Axis settings. Use Undo to get them back.
Goals
A goal is also an array, with a target for each bar. Choose the goal’s data source for a series and turn on Mark as Goal; the series is then drawn as a stepped line over the bars. Some machines only send their targets now and then, so a goal line keeps the last targets sent until new ones arrive. Goal lines cannot be used with stacked bars.
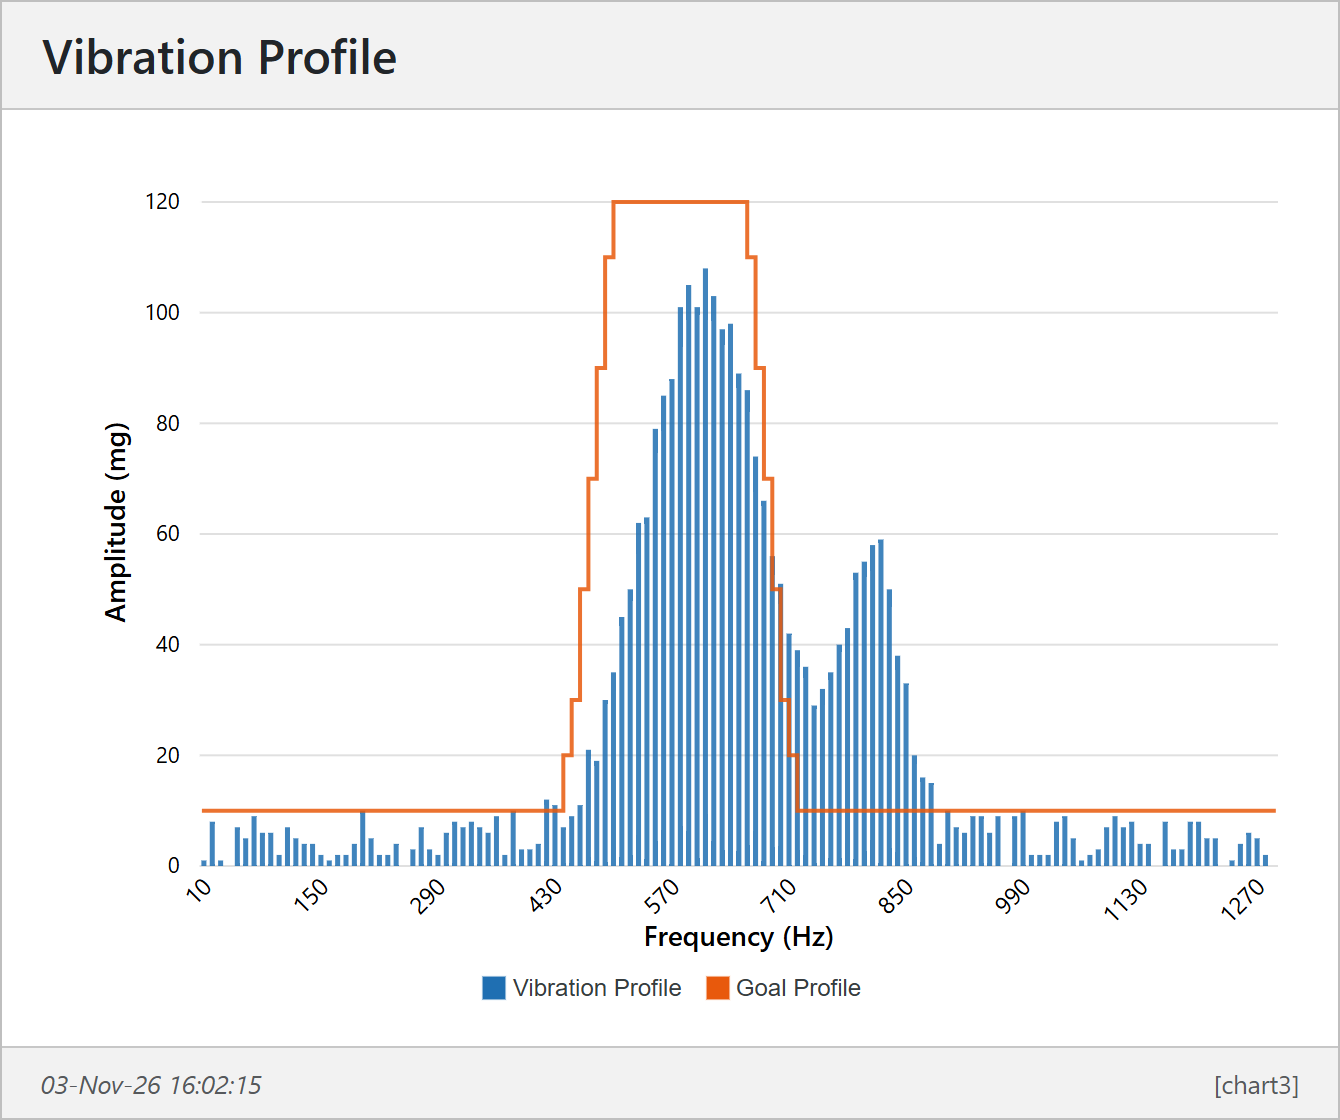
Example - Reading a vibration profile and displaying it as a bar chart
The following chart was created by reading 128 frequency bins from a vibration sensor and sending them as an array. A goal profile, which the vibration must stay under, is sent occasionally as a second array. Because the goal does not change often, it does not need to be sent with every message.
...letprofile=readVibrationProfile();// this is an arraySQ.dispatch(47,JSON.stringify(profile));...letgoal=[10,10,10,10,...,20,30,50,70,90,110,120,...,10,10];if(cycle===50){SQ.dispatch(48,JSON.stringify(goal));}...
One axis, Amplitude (mg), is used for both series: Vibration Profile [cp47], and Goal Profile [cp48] with Mark as Goal on. On the X-Axis, the Scale is 10 so that the columns are labelled in Hz.
Example - Machine load statistics on a stacked bar chart
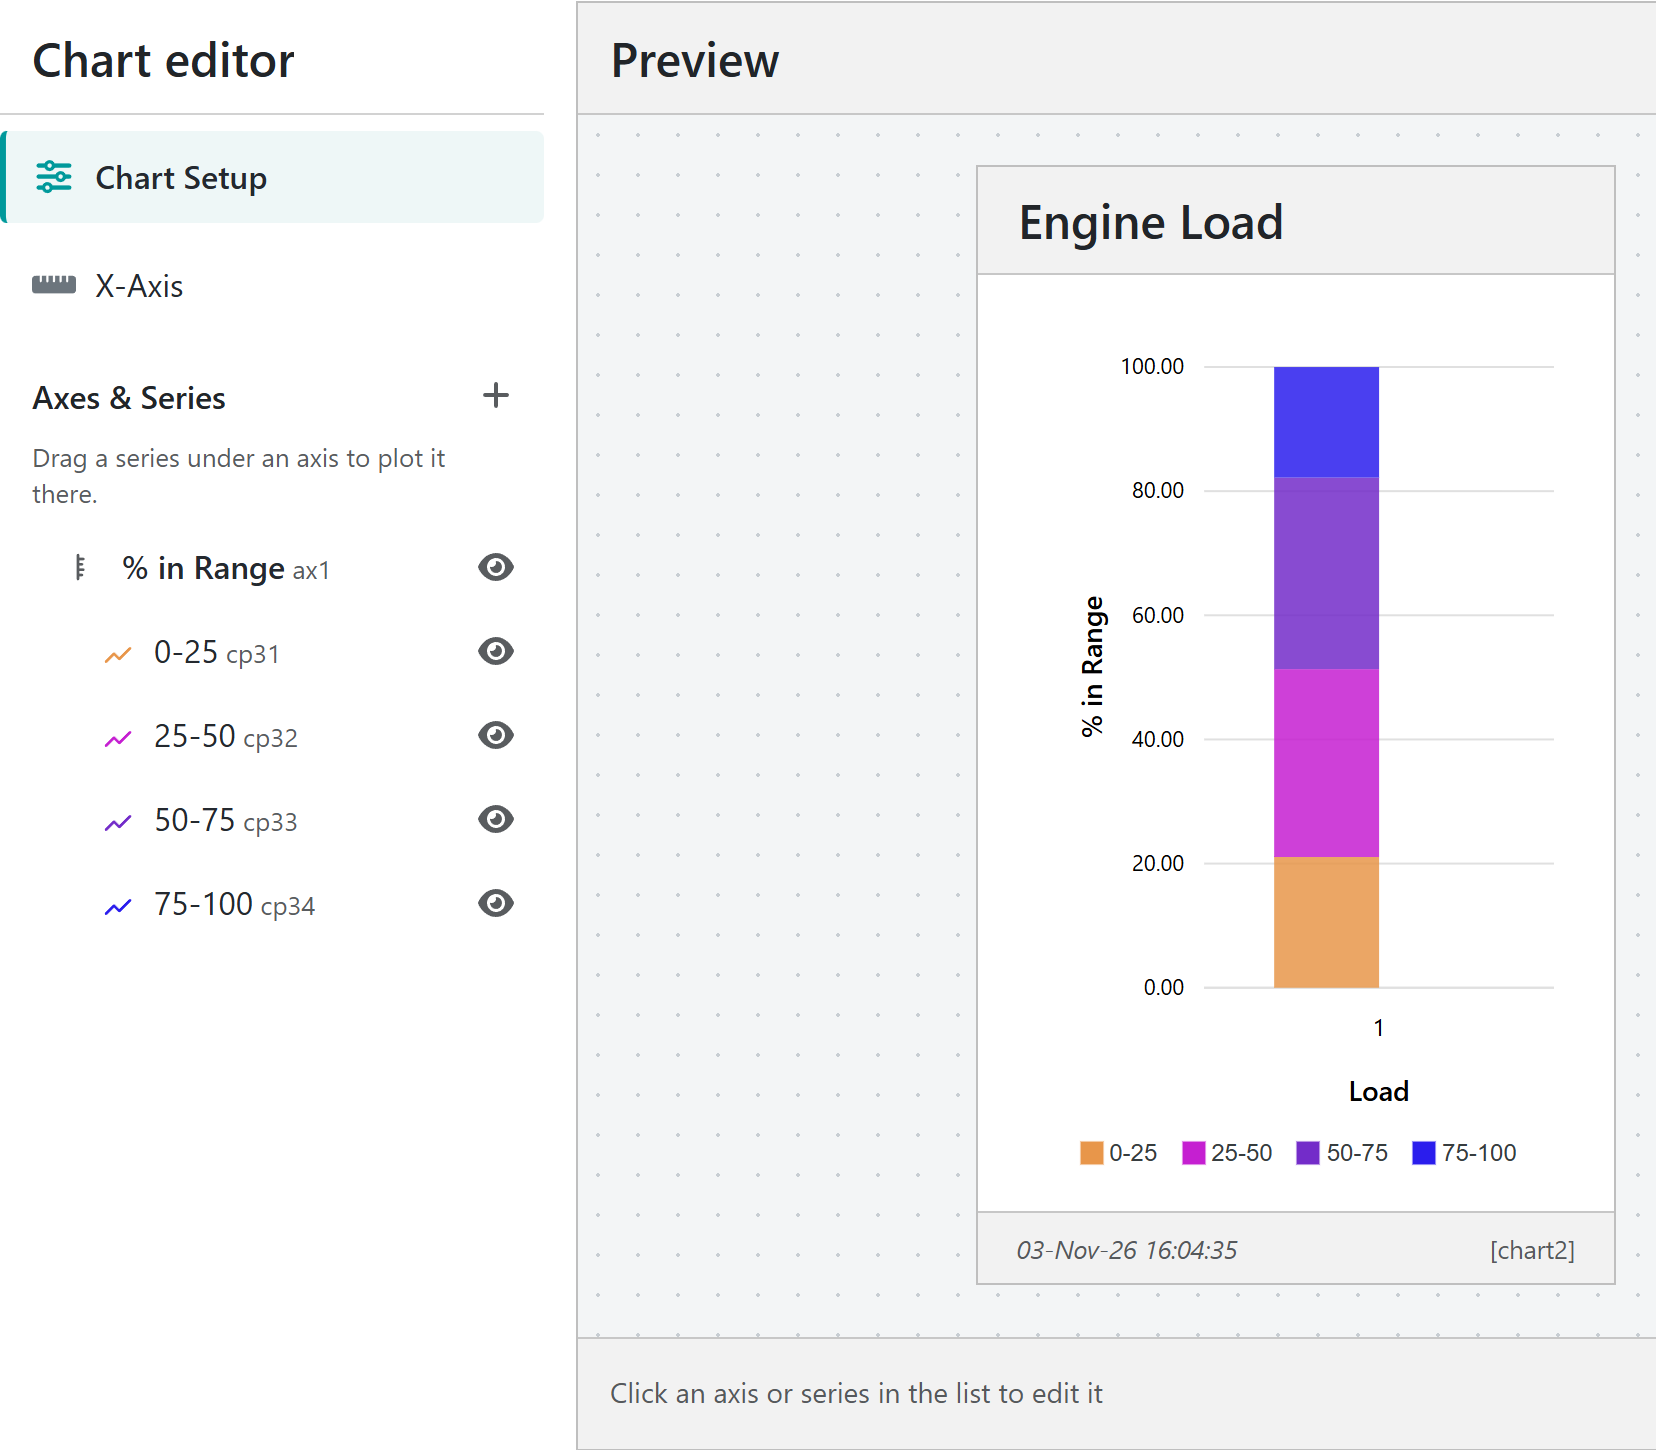
In this example, states are used to track how long a pump operates within specific load ranges. These ranges are grouped into bins: 0-25%, 25-50%, 50-75%, and 75-100%. The percentage of time the pump spends in each bin is calculated and each bin is sent as a one-item array.
// Create a load chartletload25=[];letload50=[];letload75=[];letload100=[];// Simulate some dataload25[0]=20+3*Math.random();// 0 to 25load50[0]=30+3*Math.random();// 25 to 50load75[0]=30+3*Math.random();// 50 to 75load100[0]=100-load25[0]-load50[0]-load75[0];SQ.dispatch(31,JSON.stringify(load25));SQ.dispatch(32,JSON.stringify(load50));SQ.dispatch(33,JSON.stringify(load75));SQ.dispatch(34,JSON.stringify(load100));
A single axis is used, each bin is added as a separate series, and Stacked Series is turned on so the four bins add up to 100%.
Stacked bar chart showing the percentage of time in each load range
Changes are not applied to the device data page until you select Save Settings. While there are unsaved changes, Unsaved Changes is shown above the preview. Saving keeps the editor open, so you can carry on editing.
Warning
Leaving the Chart Editor does not ask you to save first. Unsaved changes, including a new chart that has never been saved, are lost.
Undo and Redo step through up to 100 changes. A burst of typing in one field is undone in one step.
To delete a chart, select Remove chart and confirm. You return to the device data page. Remove chart is only available once the chart has been saved.
Keyboard shortcuts
On a Mac, use ⌘ in place of Ctrl.
Shortcut
Action
Ctrl + Z
Undo
Ctrl + Y or Ctrl + Shift + Z
Redo
↑ or ↓ on a series’ handle
Move the series up or down the list
Esc while dragging
Cancel the drag
While you are typing in a box, these keys do their usual job in that box instead.
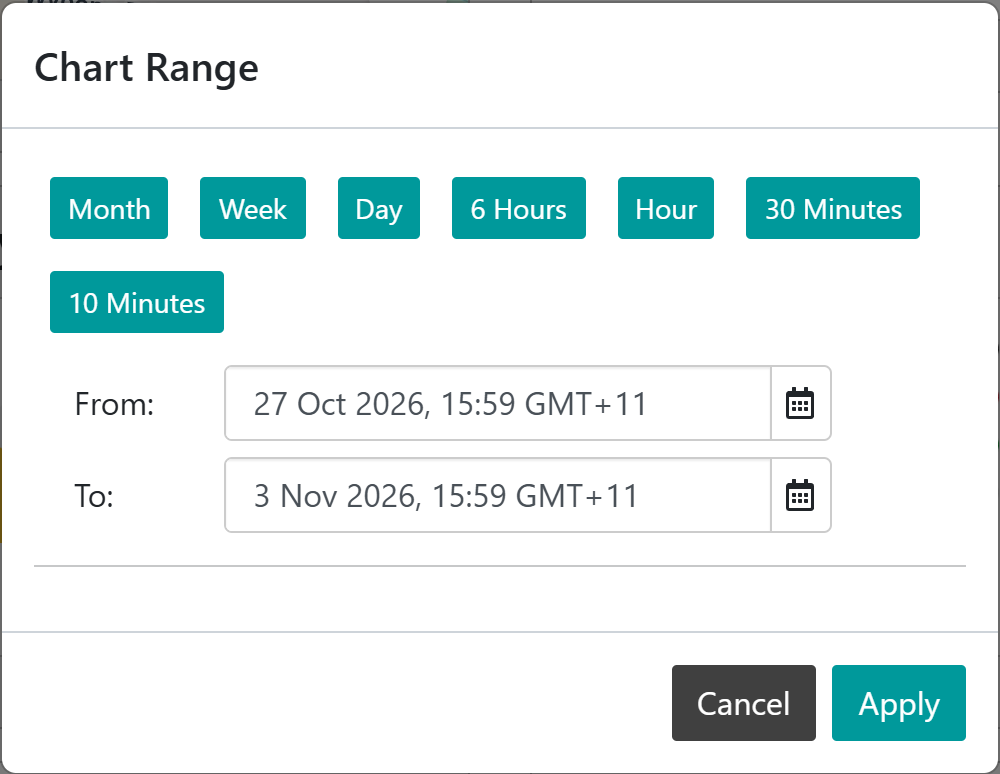
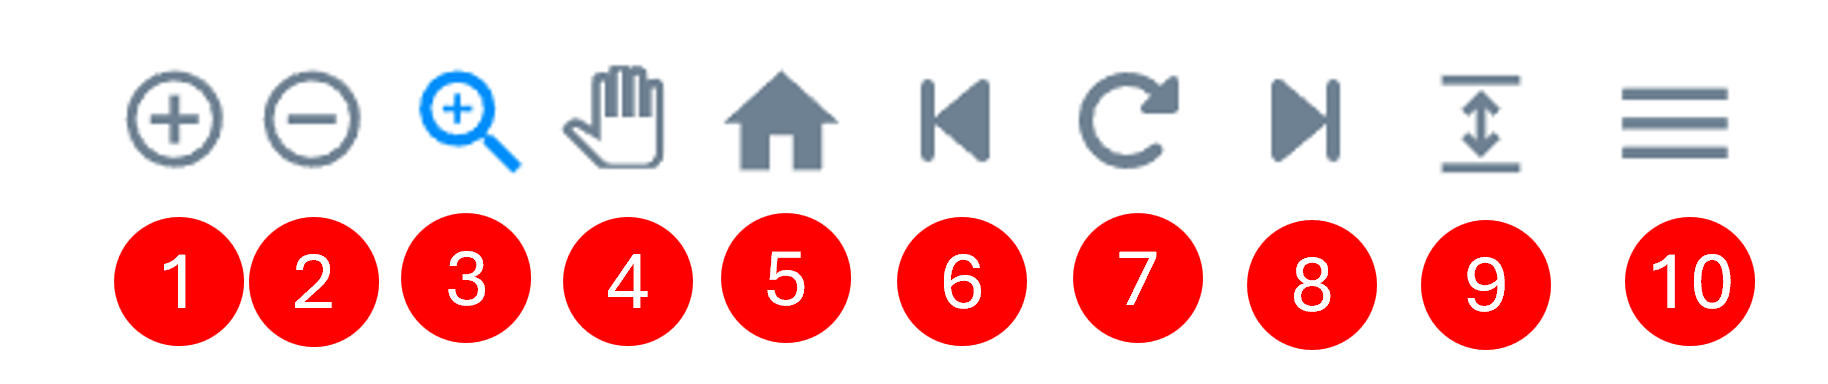
Selection Zoom: drag across the chart to zoom into that area.
Panning: drag the chart left and right.
Reset Zoom returns to the chart’s time range.
Load previous data moves the chart back in time by a quarter of the visible period.
Enhance zoomed area reloads the zoomed-in area at full resolution, to show detail that downsampling smoothed out.
Load new data moves the chart forward in time by a quarter of the visible period, up to the present.
Toggle High/Low Markers marks the highest and lowest value of each series. Not available on stacked charts.
Menu downloads the chart as an SVG or PNG image, or its data as a CSV file.
Charts refresh automatically: a 10 minute chart every 10 seconds, a 1 hour chart every minute, and a 1 day or longer chart every 10 minutes. On a phone the zoom and pan tools are hidden; expand the chart to use them. Bar charts have no toolbar.
Put units in the axis name. Axis titles are shown exactly as typed, so Oil Pressure (kPa) tells the reader more than Oil Press.
Give unrelated measurements their own axis. Plotting pressure in kPa against temperature in °C on one axis squashes one of them flat.
Set a fixed range for alarm levels. If a value should stay between known limits, set both ends of the axis range so that a drift is obvious rather than rescaled away.
Use dashed or dotted lines to tell series apart when they share a colour family, or when the chart may be printed in black and white.
Rename an axis from the preview. Select the axis name on the chart to jump straight to its settings.
Send goals occasionally. A goal line keeps the last targets sent, so a script only needs to send the goal array when it changes.
Undo is your safety net. Changing the chart type clears the X-Axis settings and removing an axis moves its series, but both can be undone until you leave the editor.
Save before you leave. The editor does not warn about unsaved changes.
The list only shows values in the device’s latest message. Type the key, for example cp48, and select Add “cp48” as Data Key. For a bar chart, the value must be an array of numbers.
The chart shows No Data
The device has not sent the data source in the chart’s time range. Try a longer Time Range, or check the key in Data Source.
A line is flat at the top or bottom of the chart
The axis Range is set and the values are outside it. Widen the range, or set both ends back to Auto.
Save Settings is greyed out
There are no unsaved changes, or the chart has no Name.
The goal line does not show
Goal lines are not drawn on stacked bar charts. Turn off Stacked Series, and check that Mark as Goal is on for the goal series.
Changes made in another browser tab were lost
Saving writes the device’s display settings as they were when the editor opened. Avoid editing a device’s display settings in two tabs at once.
The Senquip Portal offers hosting of data, a data visualisation dashboard, firmware upgrades, and device management including remote configuration and scripting. Every Senquip device purchased comes with a managed plan for the life of the product (10 years). Managed plans allow remote configuration and scripting on the Senquip Portal. Users have the option of purchasing a hosted plan to enable data hosting and data visualisation on the Senquip Portal. Hosted plans are available on a monthly, yearly, or lifetime basis (10 years), and can be purchased directly off the Senquip Portal or through distributors.
Zero cost Basic plans are most suitable for users who are hosting their data on their own server and have their own dashboards. Features of the management plan include:
To add a hosted plan to a device, a user must have a payment method associated with their Senquip Portal account. Billing details are accessed by selecting Account from the toolbar at the top of any page on the Senquip Portal.
Hosting plans for the Senquip Portal are provided by Senquip Pty Ltd and payments are securely processed by Stripe. Senquip does not store credit card details.
Once a payment method is available, users can add hosted plans to their subscription.
To add or canel hosting on devices:
from the Senquip Vision Dashboard, select Subscriptions
When adding hosting, select either Monthly or Yearly. A discount is given for yearly subscriptions.
To host devices, select Change to Hosted
to cancel hosting and return devices to a basic plan, select Change to Basic
Note
Plans can be cancelled at any time. The cancellation will be immediate and no further billing will take place. Refunds will not be issued when a plan is cancelled mid term.
Note
If a hosted plan is added in the middle of a month, a pro-rate payment for the balance of the month will be invoiced. Once one hosted plan has been added, further hosted plans will be billed on the same date as the first plan.
Warning
Where plans are cancelled, any data stored on the Portal for these devices will be lost.
When a staff member leaves an organisation, their access to Senquip devices should be removed and transferred to another user.
If your devices are organised into a Group, replacing a user is simple:
Create a Senquip Portal account for the new user if they do not already have one.
Add the new user to the Group with the required permissions.
Remove the previous user from the Group.
All devices in the Group will automatically inherit the updated permissions.
If the device is not part of a Group, the new administrator must be added to each device individually. This can be done in one of two ways.
If the device setup password is available:
Create a Senquip Portal account for the new user.
Select Add Device and enter the Device ID and setup password.
The device will be added to the new user’s account with ADMIN permissions.
Open the device page and select ADMIN to remove the previous user.
If the previous administrator’s Portal login is available:
Create a Senquip Portal account for the new user.
Login using the previous administrator’s account.
Open the device page and select ADMIN.
Add the new user as an ADMIN.
Remove the previous user.
Login using the new user’s account to verify access.
Tip
For organisations managing multiple devices, it is recommended that devices
are placed into Groups. User access can then be managed at the Group level,
allowing staff changes to be made once rather than on every individual
device.